During California’s criminal justice reforms from 2010 to the present, San Francisco and the state as a whole saw steep declines in youth arrests, and San Francisco had an unusually large decline in youth incarcerations. During that period, as San Francisco put fewer youth behind bars, the city saw a decline in arrests of youth for violent crimes, outpacing statewide drops in violence by young people. Figures 1 – 3 illustrate the sharp declines in incarcerations per youth, incarcerations per youth arrest, and violent crimes by youth during the 2010 – 22 period, both absolutely and compared to California as a whole.
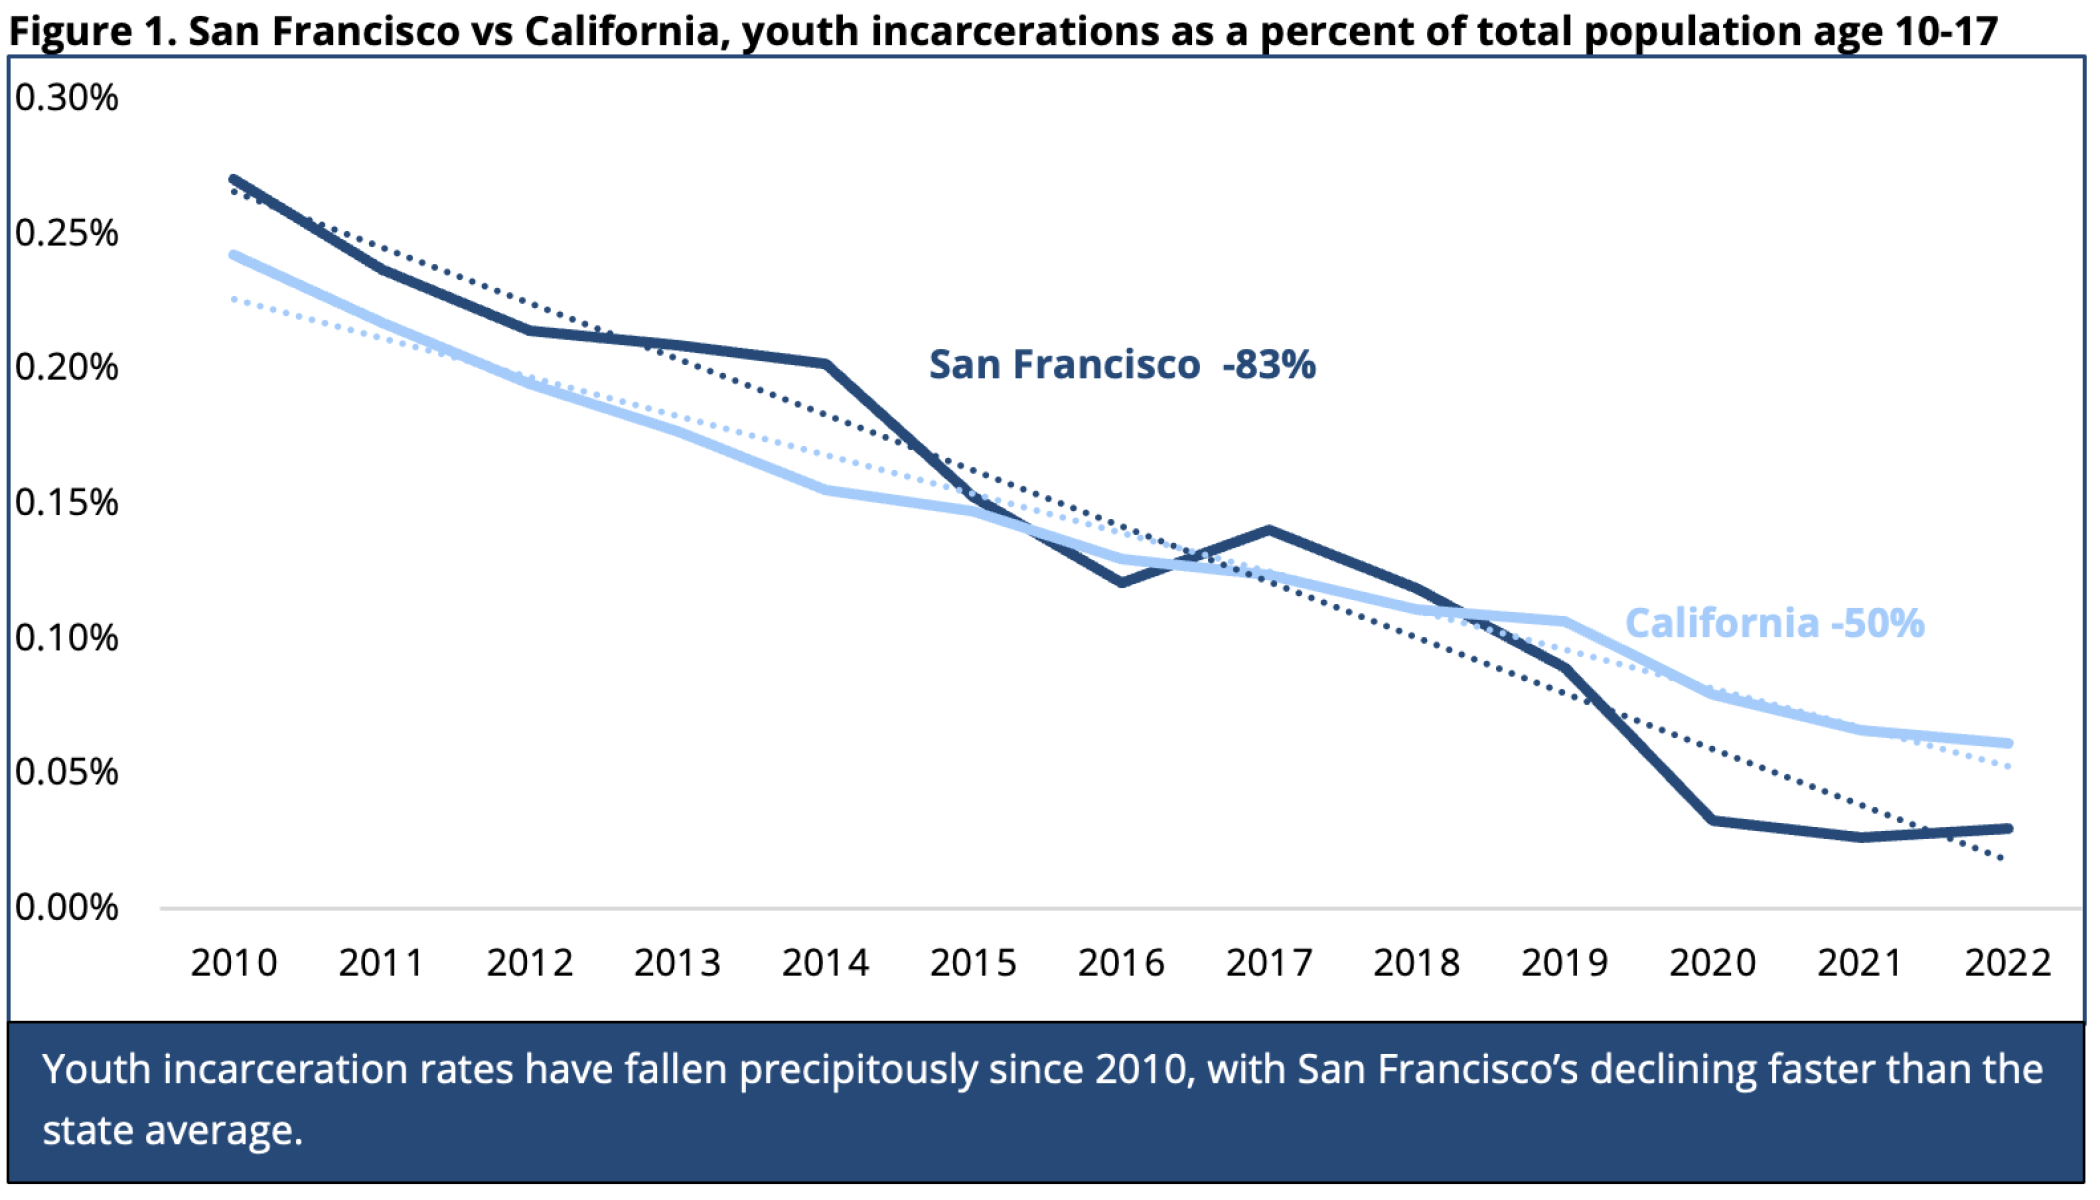
Source: BSCC, 2023; CDCR, 2023; DOJ, 2023; SFJPD, 2023. Note: Trend lines and percentage changes are calculated from regression equations that incorporate all 13 years of data.
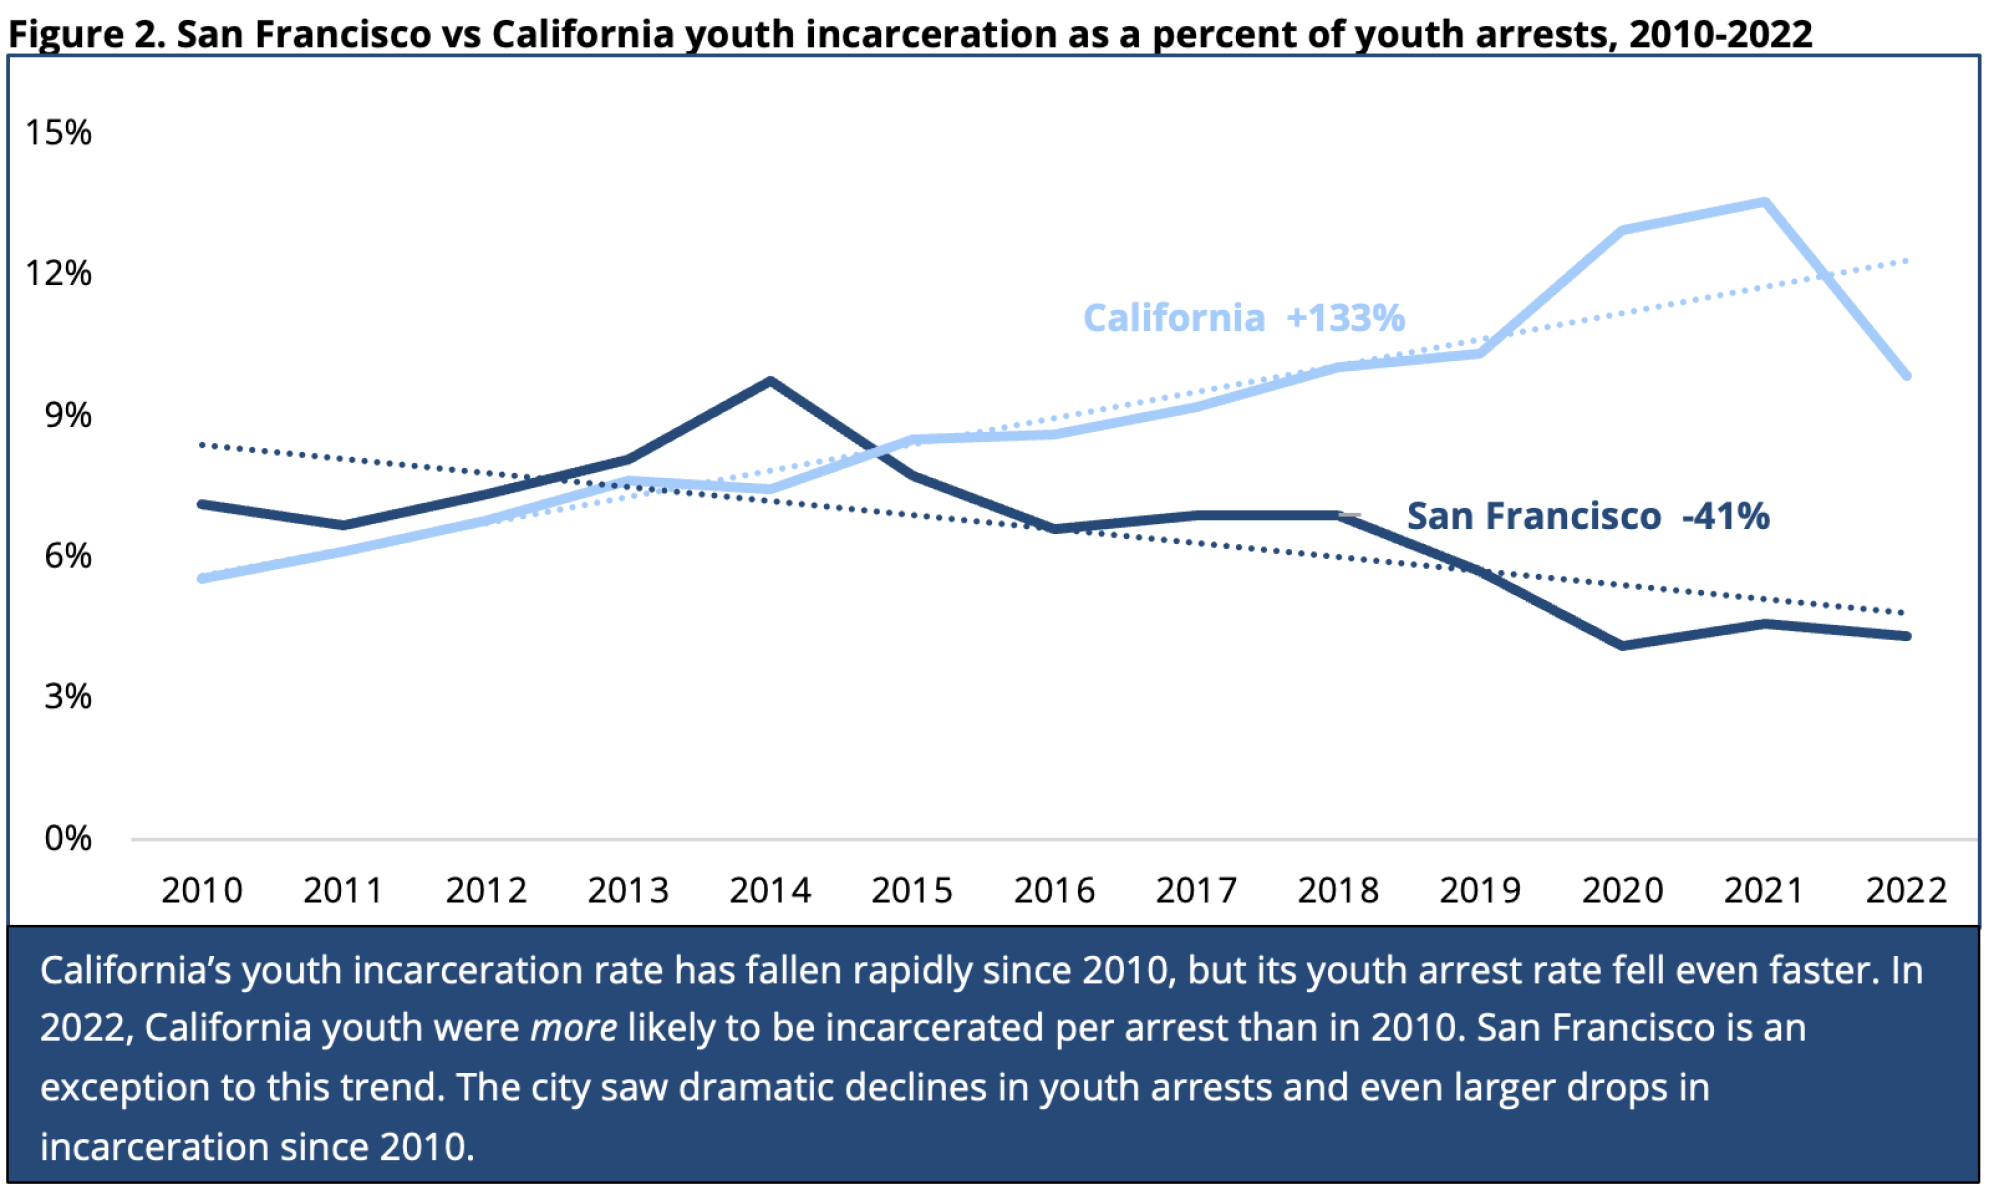
Source: BSCC, 2023; CDCR, 2023; DOJ, 2023; SFJPD, 2023. Note: Due to the SFPD’s underreporting of youth arrests by offense during 2015 – 21, SFJPD referrals for violent offenses are used for those years. Trend lines and percentage changes are calculated from regression equations that incorporate all 13 years of data.
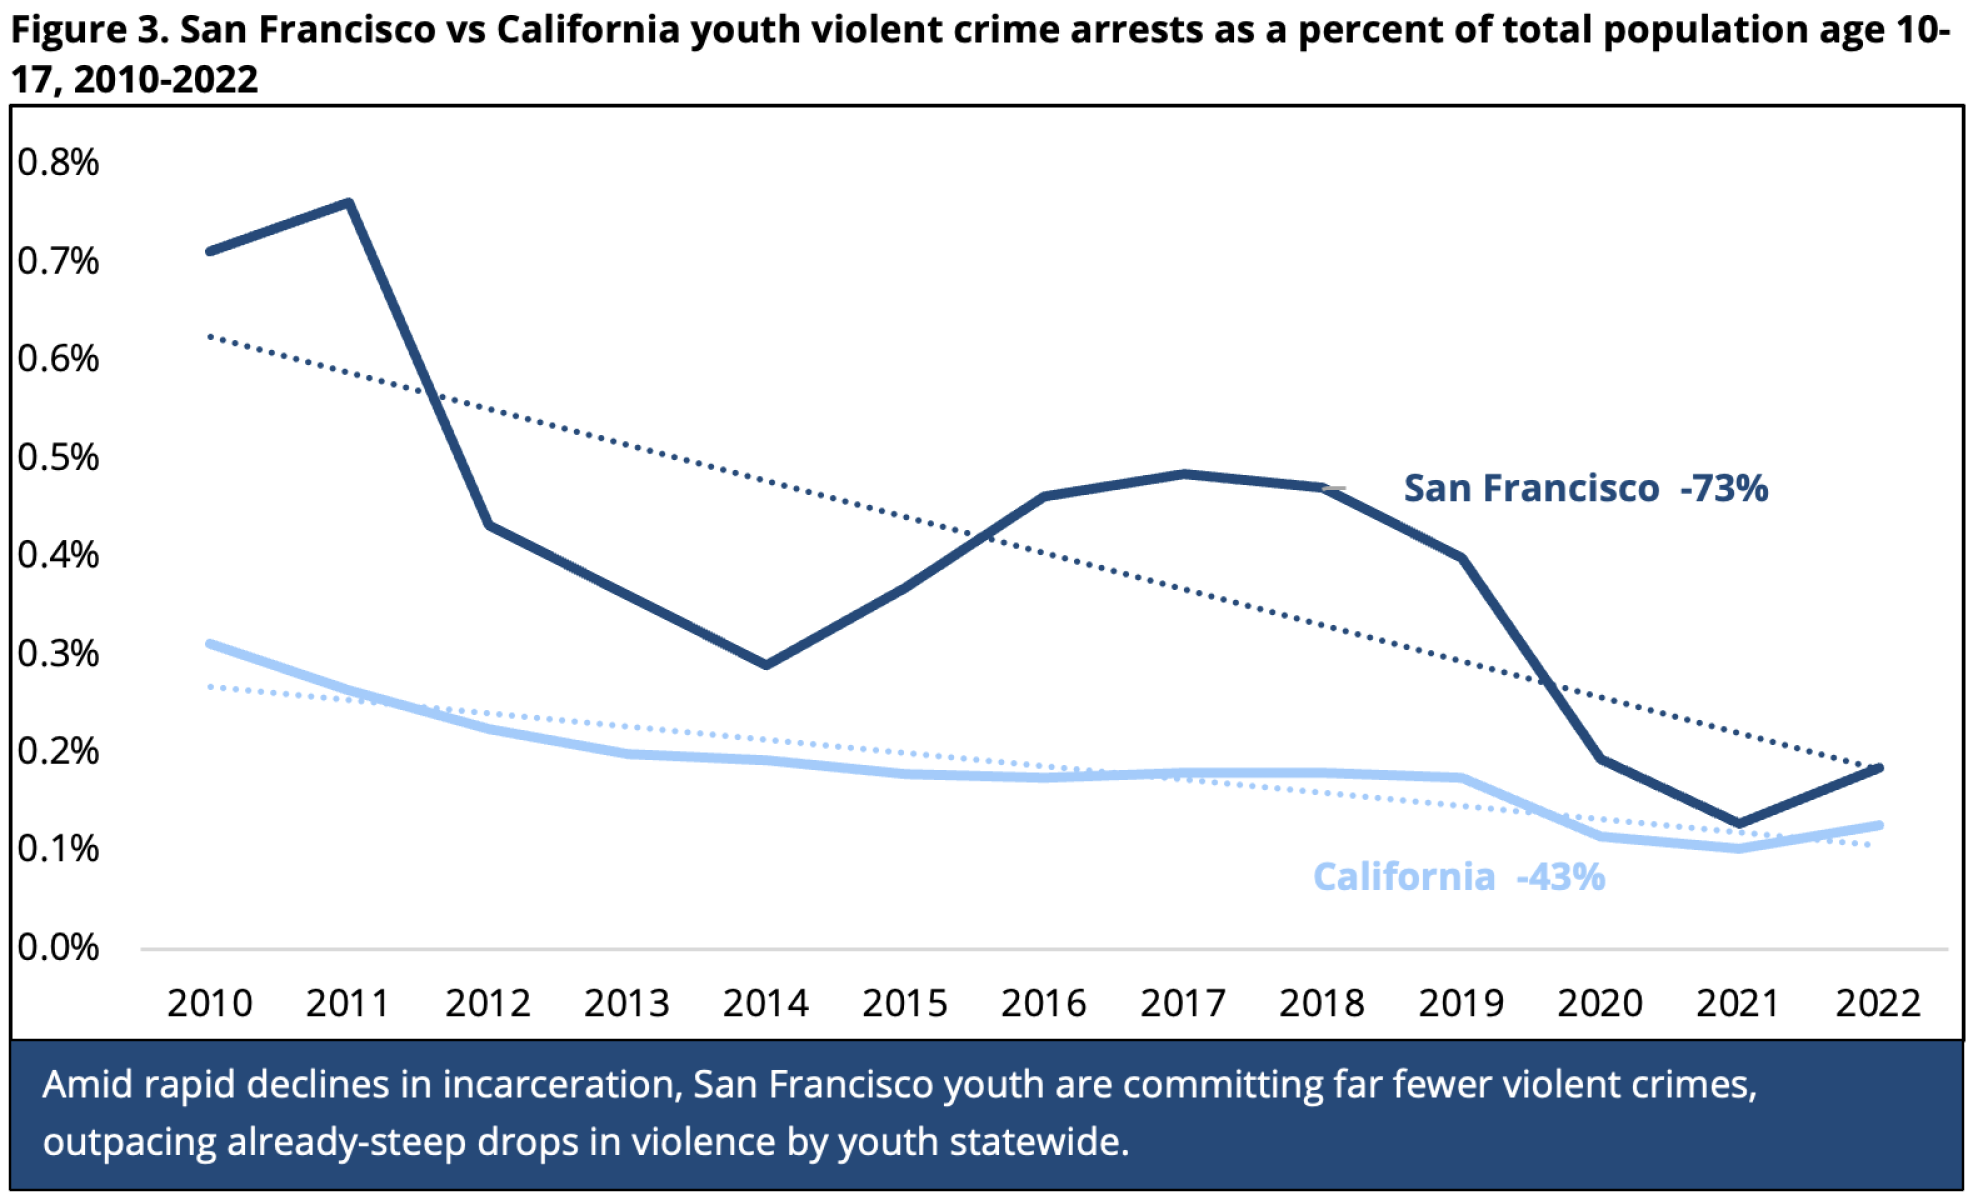
Source: BSCC, 2023; CDCR, 2023; DOJ, 2023; SFJPD, 2023. Note: Due to the SFPD’s underreporting of youth arrests by offense during 2015 – 21, SFJPD referrals for violent offenses are used for those years. Trend lines and percentage changes are calculated from regression equations that incorporate all 13 years of data.
In 2010, San Francisco youth comprised 118 of California’s 10,295 youth incarcerated in state and local detention facilities, or 1.1%. In 2022, after a large decline in juvenile arrests, San Francisco youth comprised 17 of 2,561 youth incarcerated statewide, or 0.7%. The decline in San Francisco’s youth incarcerations was not due to an unusual decrease in arrests or probation referrals.
The city’s policies augmented the drop in youth arrests to produce a much larger decline in San Francisco youth incarcerations per-capita than occurred elsewhere in California.
Rather, it appears the city’s policies augmented the drop in youth arrests to produce a much larger decline in San Francisco youth incarcerations per-capita (-83%) than occurred elsewhere in California (-50%). San Francisco’s trend and policy synergy is shown most starkly in Figure 2: an arrested youth in the city had a 41% lower chance of being incarcerated, while an arrested youth elsewhere in California was 133% more likely to be incarcerated in 2022 than in 2010.
San Francisco did not pay a price for reduced youth incarceration in terms of more serious youth crime.
San Francisco did not pay a price for reduced youth incarceration in terms of more serious youth crime. In fact, rates of violent crime by youth fell much more in San Francisco (-73%) over the 2010 – 2022 period than statewide (-43%). The rate of violent crime by San Francisco youth fell from over twice the state average in 2010 and prior years to near the state average in 2021 and 2022.
- In 1995, in a citywide youth population age 10 – 17 of 51,150, 4,271 San Francisco youth were arrested, 885 for violent crimes; 4,226 were sent to juvenile probation; and 254 were incarcerated on any given day (101 in California Youth Authority statewide youth detention facilities; 153 in local juvenile halls and camps).
- In 2010, in a youth population of 43,711, 1,658 San Francisco youth were arrested, 311 for violent crimes; 1,655 were sent to juvenile probation; and 118 were incarcerated (7 in Division of Juvenile Justice statewide youth detention facilities; 111 in local juvenile halls and camps).
- In 2022, in a youth population of 56,120, 387 San Francisco youth were arrested, 104 for violent crimes; 380 were sent to juvenile probation; and 17 were incarcerated on any given day (none in statewide youth detention facilities; 17 in local juvenile halls and camps).
Press, politician, and interest group sensationalism aside, San Francisco’s latest figures and trends show that the city’s 60,000 youths age 10 – 17 are not a serious crime or violence problem, with levels far below those of adults in their 50s. This surprising development has occurred at a time when the city’s diverse youth are less policed, less incarcerated, and more on the streets than ever before.
The unusually large reductions in serious crime by San Francisco youth, assisted by city policies emphasizing alternatives to incarceration, has left the city’s diversified juvenile justice system in an ideal position to push forward with more innovation. The major problem with the present system is high cost – $625,000[1] to $850,000[2] per youth held in the hall per year – and little evidence that incarceration reduces recidivism. The next phase, given an incarcerated youth population less than one-fifth the size it was just 12 years ago, and one-fifteenth the size of 30 years ago, is to innovate new strategies to:
- Reduce youths’ system involvement even further by selling the current juvenile hall and limiting facility size and detention use in a new, smaller, state-of-the-art hall;
- Equalize defense representation resources to modernize advocacy for more individually tailored, alternative sentencings; and
- Enhance education and job opportunities for youth facing reintegration difficulties by transferring Log Cabin Ranch to the California Conservation Corps.
References
Board of State and Community Corrections (BSCC) (2023). Juvenile detention survey — online querying. At: http://app.bscc.ca.gov/joq/jds….
California Department of Corrections and Rehabilitation (CDCR) (2023). Characteristics of the Division of Juvenile Justice Population. Issued June and December of each year; obtained by special request to CDCR.
California Department of Justice (DOJ). (2023). Open Justice. Arrests. At: https://openjustice.doj.ca.gov….
Office of the Mayor. (2023). May Proposed Budget, 2022 – 23 and 2023 – 24. City & County of San Francisco. At: https://sf.gov/sites/default/f….
San Francisco Juvenile Probation Department (SFJPD). (2023). Juvenile Probation Department Reports. At: https://sf.gov/reports/october….
[1]
Based on the 2022 – 23 Mayor’s Budget’s projected juvenile hall average daily population of 30 youth (Office of the Mayor, 2023).
[2]
Based on the actual hall average daily population of 22 from January through September 2023 (Office of the Mayor, 2023; SFJPD, 2023).
Please note: Jurisdictions submit their data to the official statewide or national databases maintained by appointed governmental bodies. While every effort is made to review data for accuracy and to correct information upon revision, CJCJ cannot be responsible for data reporting errors made at the county, state, or national level.
Contact: For more information about this topic or to schedule an interview, please contact CJCJ Communications at (415) 621‑5661 x. 103 or cjcjmedia@cjcj.org.