This is the fourth report in CJCJ’s California Juvenile Justice Realignment Series. Report author Daniel Macallair is CJCJ’s Executive Director. He is also the Practitioner-in-Residence and Lecturer with the Department of Criminal Justice Studies at San Francisco State University.
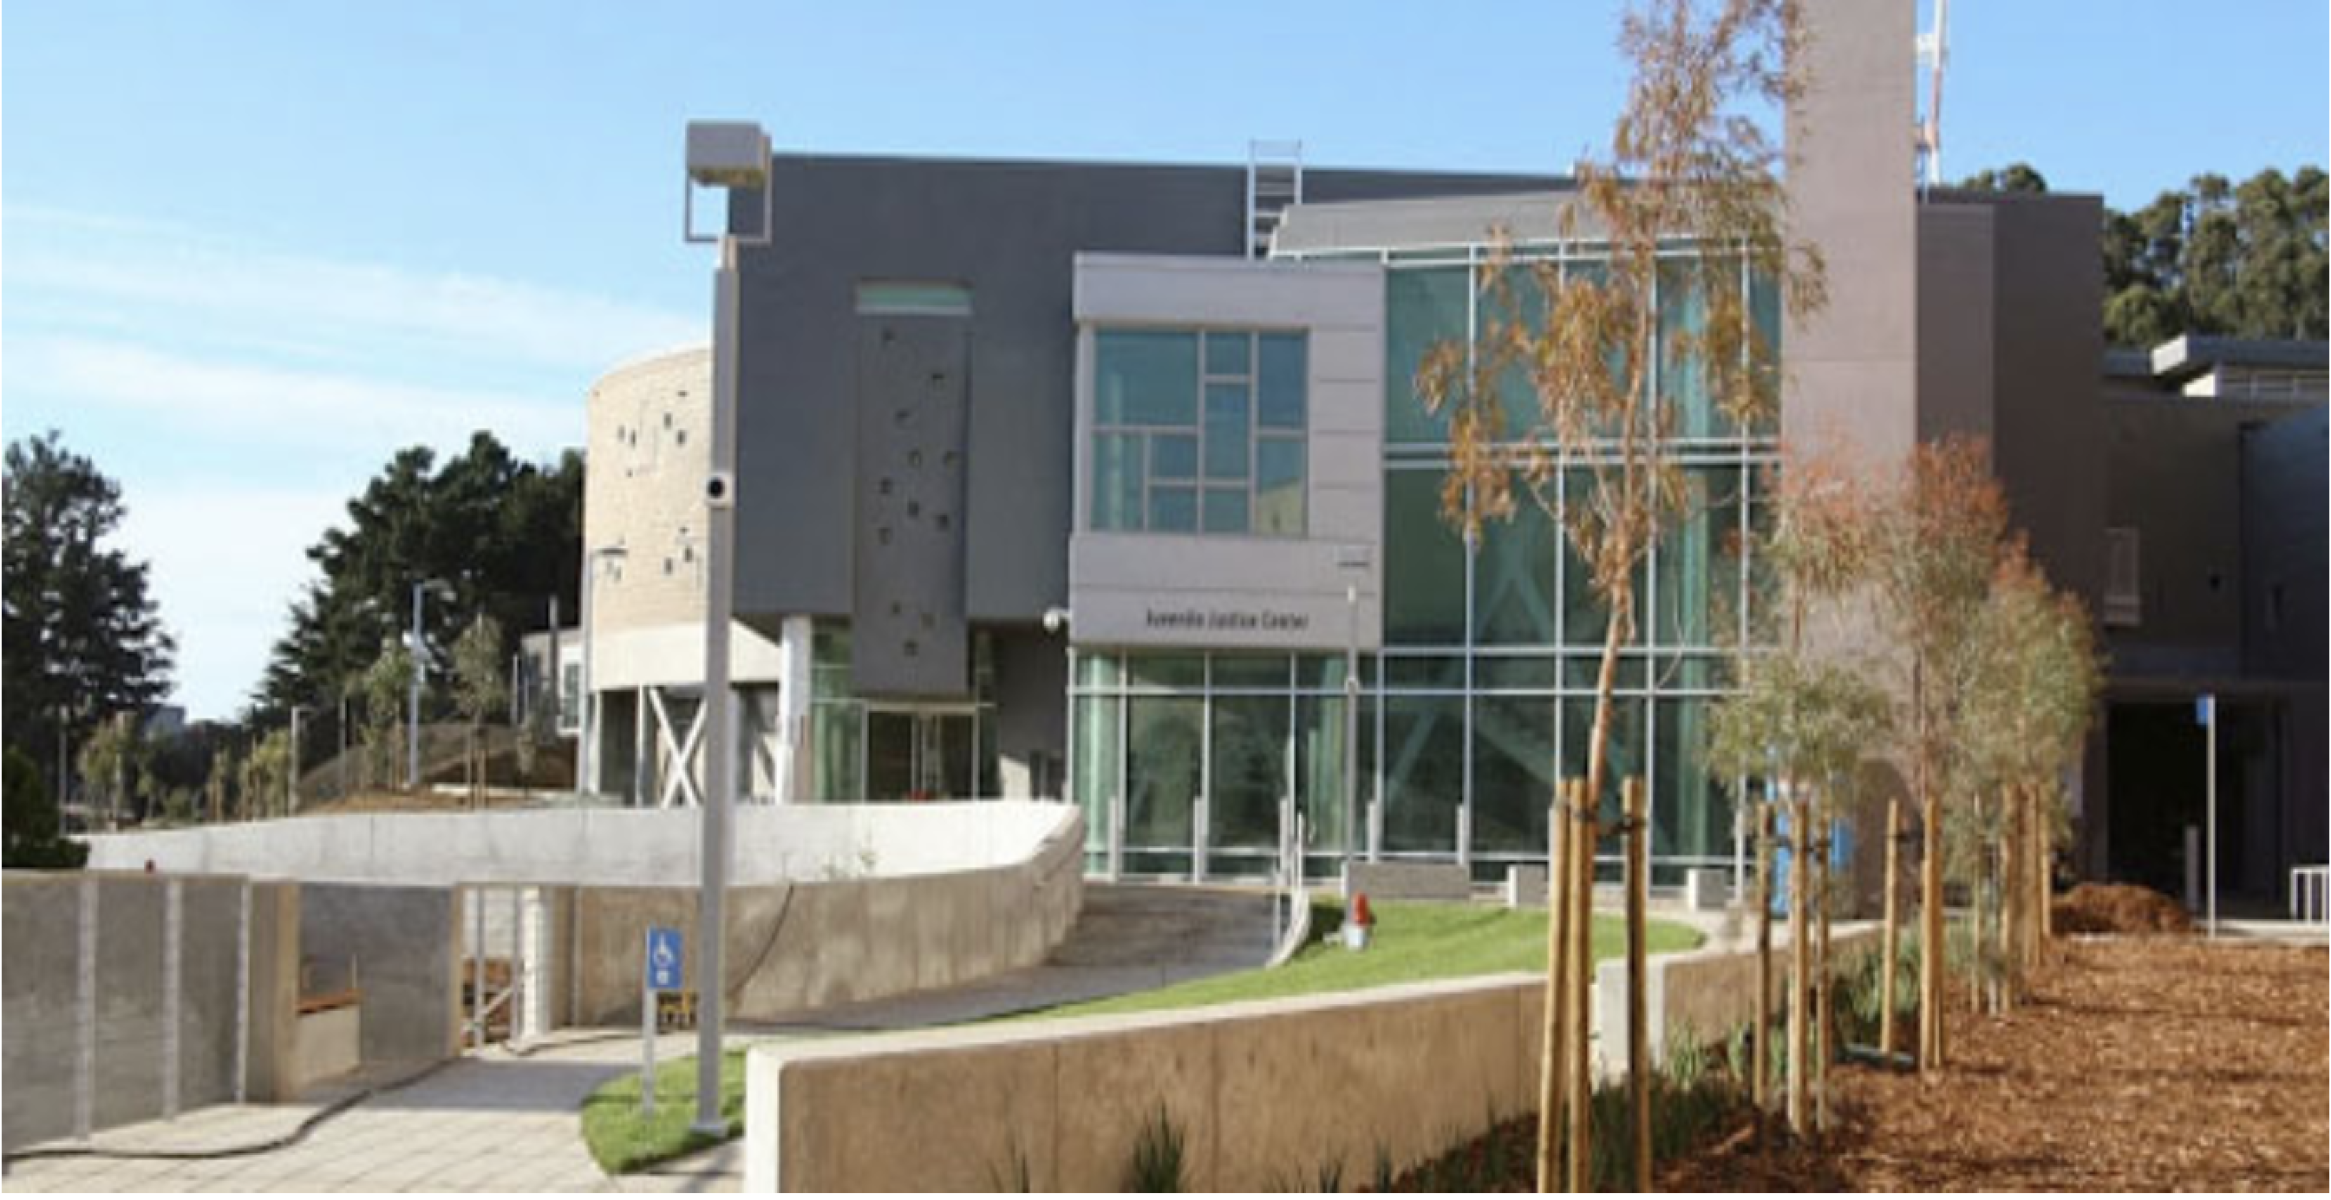
San Francisco’s Juvenile Justice Center
Executive Summary
Between 1999 and 2010, California undertook the most significant expansion of county-run juvenile detention facilities in its history. By November 2007, at least 58 construction and renovation projects had been completed across 41 counties, including 22 entirely new facilities built from the ground up. These projects were supported by more than $438 million in state and federal construction grants (Corrections Standards Authority, 2007; Teji, 2012). Subsequent legislation, including SB 81 in 2007 and AB 1628 in 2010, increased lease-revenue bond financing for local juvenile facility construction from $100 million to $300 million (BSCC, 2026b; Legislative Analyst’s Office, 2019). This expansion unfolded while youth arrests were in a sustained decline (California Department of Justice, 1990 – 2015; BSCC, 1999 – 2010).
This expansion was not a response to rising crime. Rather, it reflected a convergence of political fear, flawed forecasting models, and public financing mechanisms that incentivized detention construction. Consultant projections routinely overstated future detention populations, and federal and state funding structures made large-scale infrastructure projects financially attractive to counties, even as the evidence pointed firmly in the opposite direction.
The consequences remain visible today. California maintains far more juvenile detention capacity than it uses. While state and federal funding helped counties absorb construction costs, counties were left to bear the ongoing costs of staffing, maintenance, medical services, and security infrastructure. Confinement is the most expensive option counties operate and among the least effective at reducing reoffending (Mendel, 2011; Justice Policy Institute, 2009).
California built for a youth crime wave that never came. Counties are still paying for it.
Key Findings
- California dramatically expanded juvenile detention capacity as youth crime declined. Between 1999 and 2007, at least 58 construction and renovation projects were completed across 41 counties, including 22 new facilities, supported by more than $438 million in state and federal grants.
- Expansion occurred during a sustained, historic decline in youth crime. By 2015, juvenile arrests fell more than 70 percent from their 1994 peak.
- Population forecasts overstated future detention needs. Many consultant projections relied on the crime peaks of the early 1990s and failed to adequately account for declining arrests, policy changes, and other emerging trends.
- Federal and state funding incentives rewarded construction over prevention, lowering counties’ upfront capital costs while leaving them responsible for long-term operating obligations.
- California now maintains substantial excess juvenile detention capacity, with statewide utilization at roughly 31 percent.
Core Recommendations
To address this mismatch, Report No. 4 recommends aligning detention capacity with demonstrated need, strengthening forecasting accountability, expanding diversion, and reinvesting in community-based services.
- Right-size California’s juvenile detention system through statewide utilization audits grounded in demonstrated need.
- Reinvest in community-rooted nonprofit organizations providing youth services, diversion, mental health support, and other community-based alternatives to confinement.
- Expand and prioritize diversion and restorative practices as the default response for low and moderate risk youth, reducing unnecessary reliance on detention.
- Strengthen accountability and transparency in population forecasting through mandatory independent review and regular comparison of projections with actual outcomes before forecasts are used to justify major capital investments.
- Realign fiscal priorities so prevention and youth development receive investment parity with physical infrastructure.
Read the Full Report
Report No. 4 examines how California’s juvenile detention system became misaligned with actual youth crime and detention trends, and what the state can do now to right-size capacity and redirect resources.
You can read the full report, along with the other releases in CJCJ’s California Juvenile Justice Realignment Series, under Reports & Publications.
Selected References
Annie E. Casey Foundation. (2019). Transforming juvenile probation: A vision for getting it right. Annie E. Casey Foundation.
Becker, E. (2001, February 9). As ex-theorist on young “superpredators,” Bush aide has regrets. The New York Times.
Buschell, R. (2007). AB 900 — Response from the Center on Juvenile and Criminal Justice. CJCJ. https://www.cjcj.org/media/imp…
California Board of State and Community Corrections (BSCC). (1999 – 2010). Juvenile facility construction grants: Program records and reports. State of California.
California Board of State and Community Corrections (BSCC). (2022). Juvenile Detention Profile Survey Query: Fourth Quarter 2022 data. State of California. https://www.bscc.ca.gov/s_fsoj…
California Department of Finance. (Various years). California demographic projections. State of California.
California Department of Justice. (1990 – 2015). Crime in California: Annual report. California Attorney General’s Office.
California State Auditor. (2012). Juvenile justice realignment (Report No. 2011-129). Bureau of State Audits.
Corrections Standards Authority (CSA). (2007). Completed construction projects: Juvenile facilities. Sacramento, CA: CDCR.
DiIulio, J. J., Jr. (1995). The coming of the super-predators. The Weekly Standard, 1(11), 23 – 28.
Gilliam, F. D., Jr., & Iyengar, S. (2000). Prime suspects: The influence of local television news on the viewing public. American Journal of Political Science, 44(3), 560 – 573.
Herrnstein, R. J., & Murray, C. (1994). The bell curve: Intelligence and class structure in American life. Free Press.
Justice Policy Institute. (2009). The costs of confinement: Why good juvenile justice policies make good fiscal sense.
Macallair, D., Males, M., & McCracken, C. (2009). Closing California’s Division of Juvenile Facilities: An analysis of county institutional capacity. Center on Juvenile and Criminal Justice.
Macallair, D., McCracken, C., & Teji, S. (2011). The impact of realignment on county juvenile justice practice: Will closing state youth correctional facilities increase adult criminal court filings? Center on Juvenile and Criminal Justice.
Males, M., & Macallair, D. (2010). The California miracle: Drastically reduced youth incarceration, drastically reduced youth crime. Center on Juvenile and Criminal Justice.
Mendel, R. A. (2011). No place for kids: The case for reducing juvenile incarceration. Annie E. Casey Foundation.
National Research Council. (2013). Reforming juvenile justice: A developmental approach. The National Academies Press.
Office of Juvenile Justice and Delinquency Prevention (OJJDP). (Various years). JABG and Title II Formula Grant program records. U.S. Department of Justice.
Petrosino, A., Turpin-Petrosino, C., & Guckenburg, S. (2010). Formal system processing of juveniles: Effects on delinquency. Campbell Systematic Reviews, 6(1), 1 – 88.
SB 81 (2007). Local Youthful Offender Rehabilitative Facility Construction Financing Program, Chapter 175, Statutes of 2007 (as amended by AB 1628). California Legislature.
Teji, S. (2012). Counties’ modern secure facilities have enough institutional capacity for juvenile justice realignment. CJCJ.
Violent Crime Control and Law Enforcement Act, Pub. L. No. 103 – 322, 108 Stat. 1796 (1994).
AI Disclosure: This report was prepared with the assistance of AI tools. All analysis, writing, conclusions, and editorial judgments are the author’s own.