Introduction
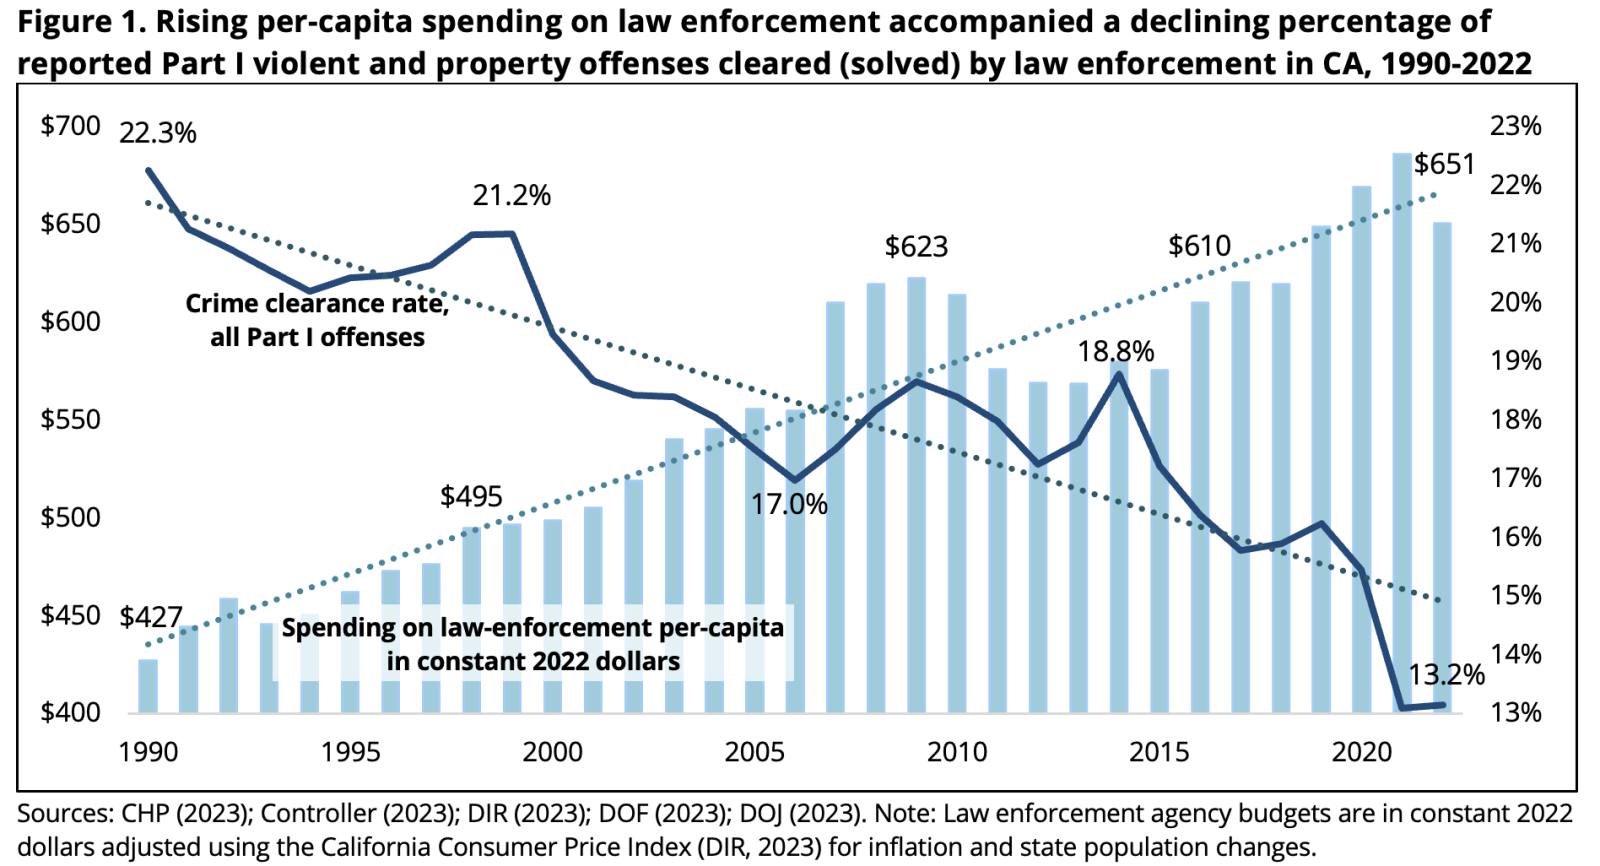
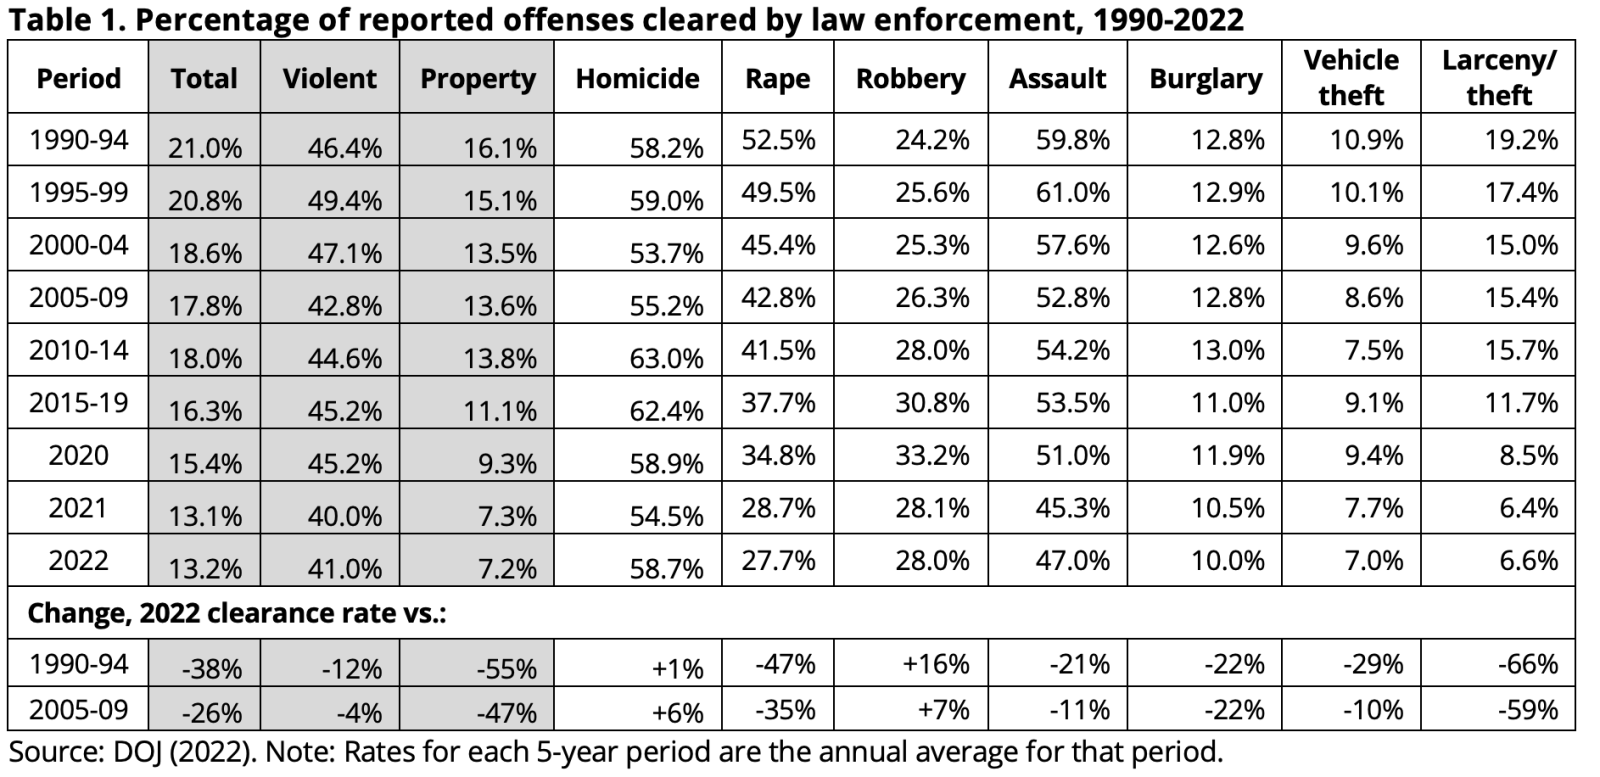
California is not “defunding the police” nor implementing lenient criminal justice reforms – just the opposite. State spending on law enforcement has risen sharply, even after adjustments for inflation and population growth. The odds of being imprisoned per arrest have risen to near-record heights. However, despite record spending on California law enforcement agencies1 in recent years, one of the core measures of law enforcement effectiveness— crime clearance rates — has fallen to historically low levels. An agency’s clearance rate is the share of Part I violent and property crimes2 that are considered solved after law enforcement makes an arrest. Over the past three decades, these clearance rates fell by 41%, from a 22.3% clearance rate in 1990 to 13.2% in 2022, which equates to fewer than one in seven crimes solved (Figure 1, Table 1). California’s decline in overall clearance rates has been driven by falling property felony clearances (-59%), though the solve rate for violent felonies also fell during the 1990 – 2022 period (-14%).
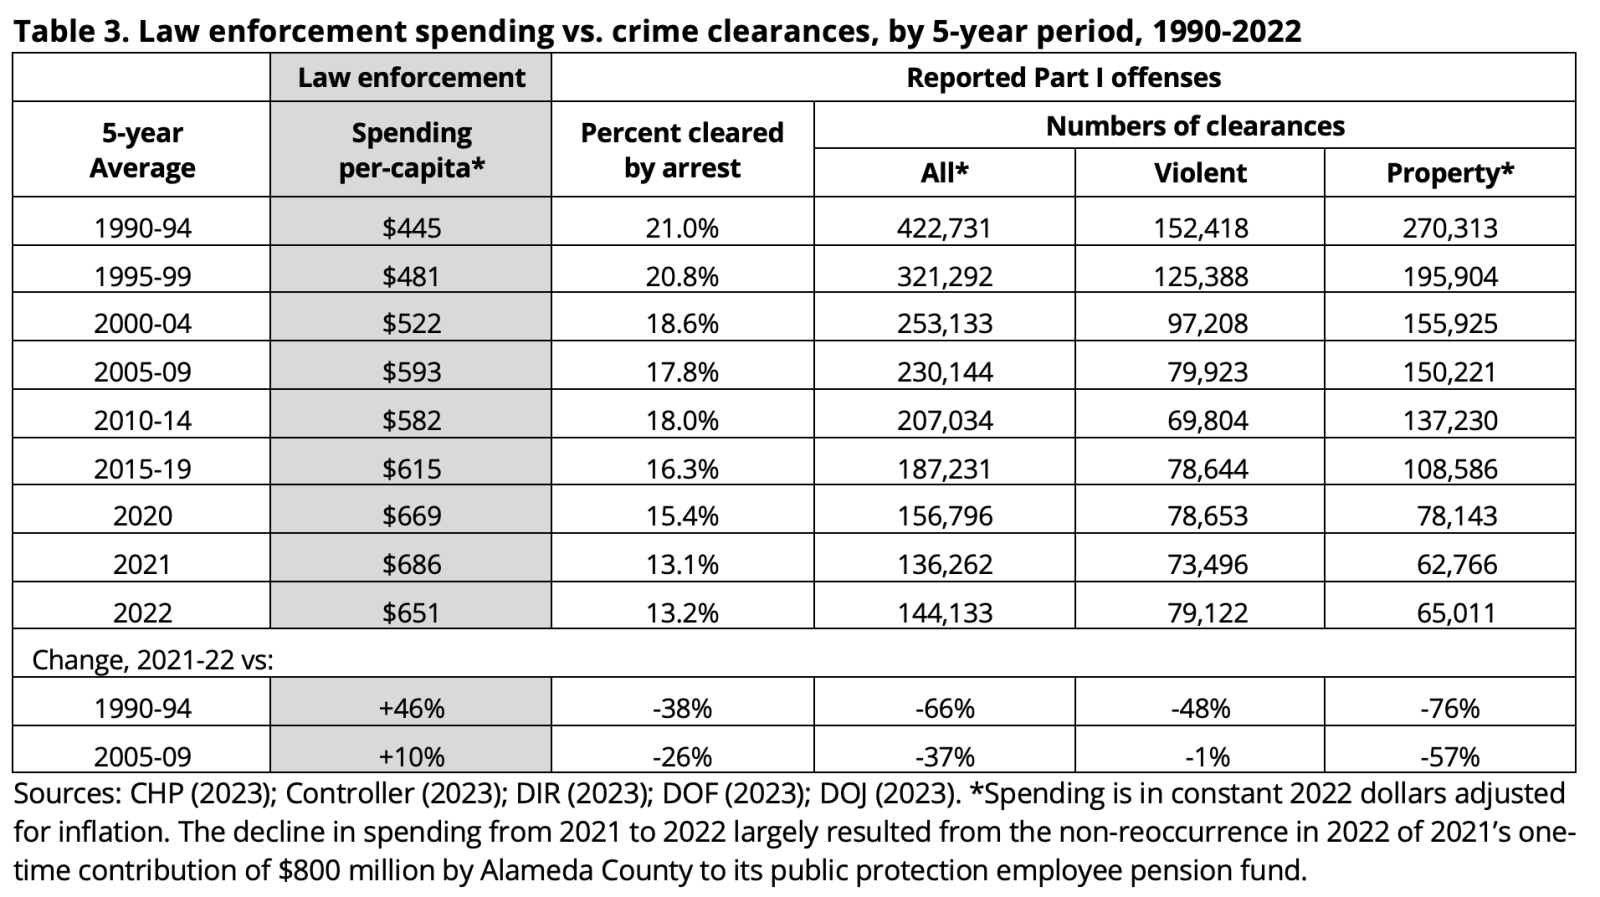
This steep decline in crime-solving has occurred despite ballooning law enforcement budgets. From 1990 to 2022, Californians’ per-capita spending on law enforcement rose by 52% in constant, inflation-adjusted dollars to a total of roughly $25.5 billion (Figure 1, Table 1).3 California’s police are hardly being “defunded;” rather, they are receiving record high per-capita funding.
Are law enforcement agencies effective at solving crime? This analysis of major changes in the percentage of offenses cleared by the arrest of a suspect over the last 33 years finds surprising results:
- Despite steep declines in crime and major per capita spending increases, law enforcement now solves fewer than one in seven serious crimes, a 41% decrease in solving crimes over the last 33 years. In 1990, law enforcement agencies cleared 439,000 Part I violent and property felonies (22.3% of reported Part I crimes); in 2022, just 144,000 (13.2% of reported Part I crimes).
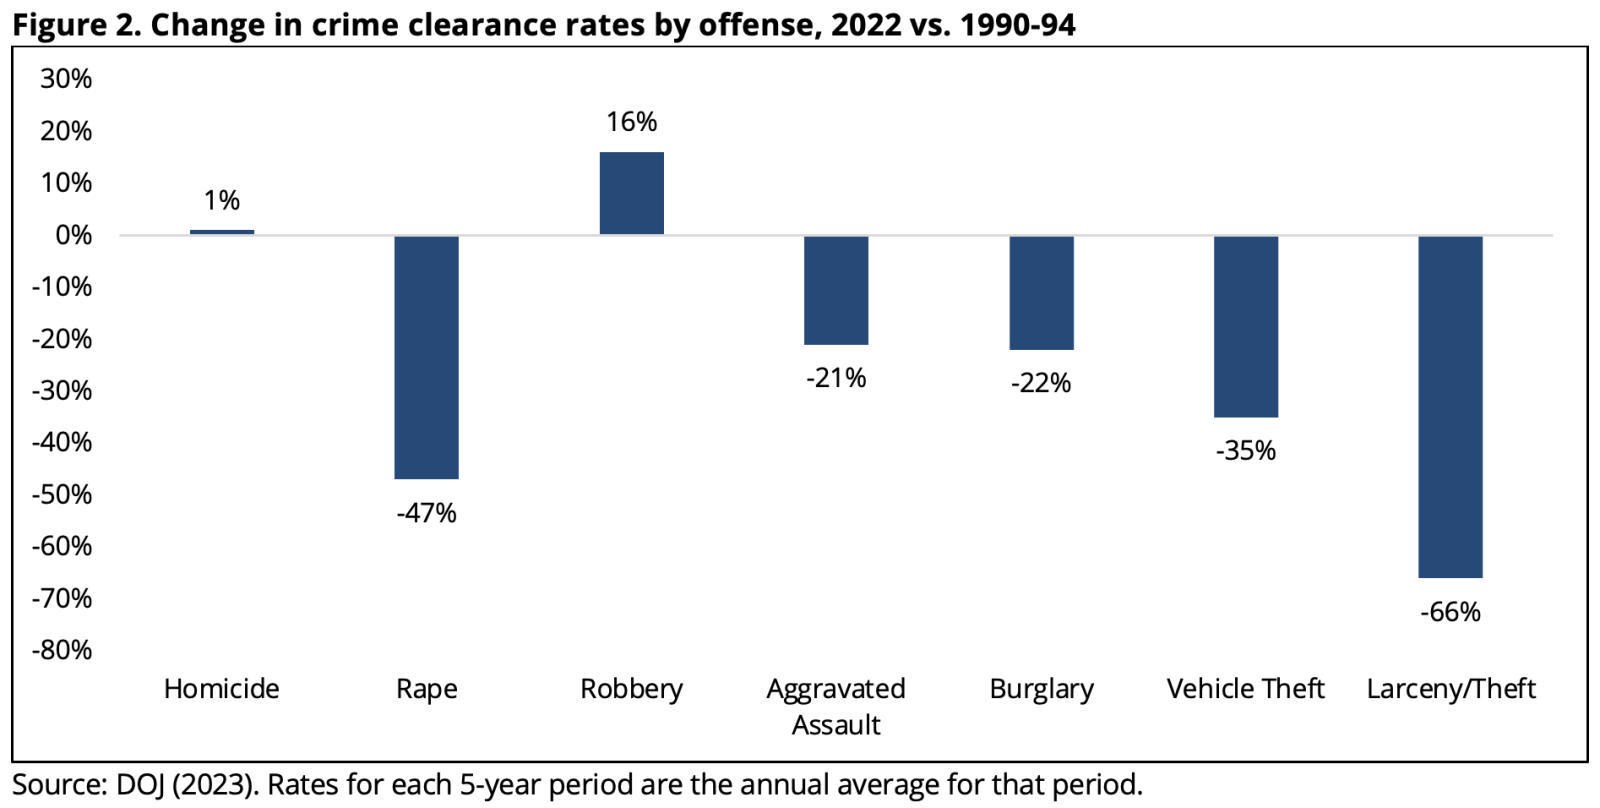
- Since 1990, clearance rates have plummeted for rape, aggravated assault, burglary, motor vehicle theft, and larceny/theft offenses. During this period, clearance rates rose by 16% for robbery and by 1% for homicide (Figure 2).
- Crime clearance rates vary widely by county and city, suggesting that local approaches to crime solving are more important than state laws or prosecution practices in determining whether persons are held accountable for crime. Additionally, some law enforcement officials express frustration with major retailers allegedly not cooperating with anti-theft efforts (Sacramento Bee, 2023).
- California is now more likely to imprison someone arrested by law enforcement. The rate of imprisonment per cleared (solved) violent and property felony has risen by 207% since 1990. However, due to the declining property crime clearance rate, total imprisonments for property crime have fallen substantially. While reforms also lowered imprisonment rates, law enforcement’s low clearance rates, not reforms or purported prosecutor and court leniency, explain this decline.
- Clearance rates had already fallen substantially prior to the start of California’s criminal justice reform era in 2011 (see Method).
Results
- Police solved just 13.2% of Part I felonies in 2022, a decline from 22.3% in 1990.
Police cleared (made an arrest to solve) 13.2% of all Part I offenses reported to them in 2021, including 41.0% of violent offenses and 7.2% of property offenses (Table 1). Much of this shift was driven by property offense clearances, which have fallen steadily and sharply (16.1% in 1990 – 94; 13.8% in 2010 – 14; falling to 7.2% in 2022). Declining property crime clearances are due to substantial reductions in clearances for larceny/theft (-66%), vehicle theft (-29%), and burglary (-22%). These trends long predate the criminal justice reform era, which began in 2011.
Clearance rates for violent offenses have fallen more moderately than those for property crime, from an average of 46.4% in 1990 – 94 to 41.0% in 2022. The homicide clearance rate has stayed steady while robbery clearances have risen; rape and assault clearances have fallen sharply during this period.
- Reported crime has fallen steeply, leaving far fewer crimes for police departments to solve
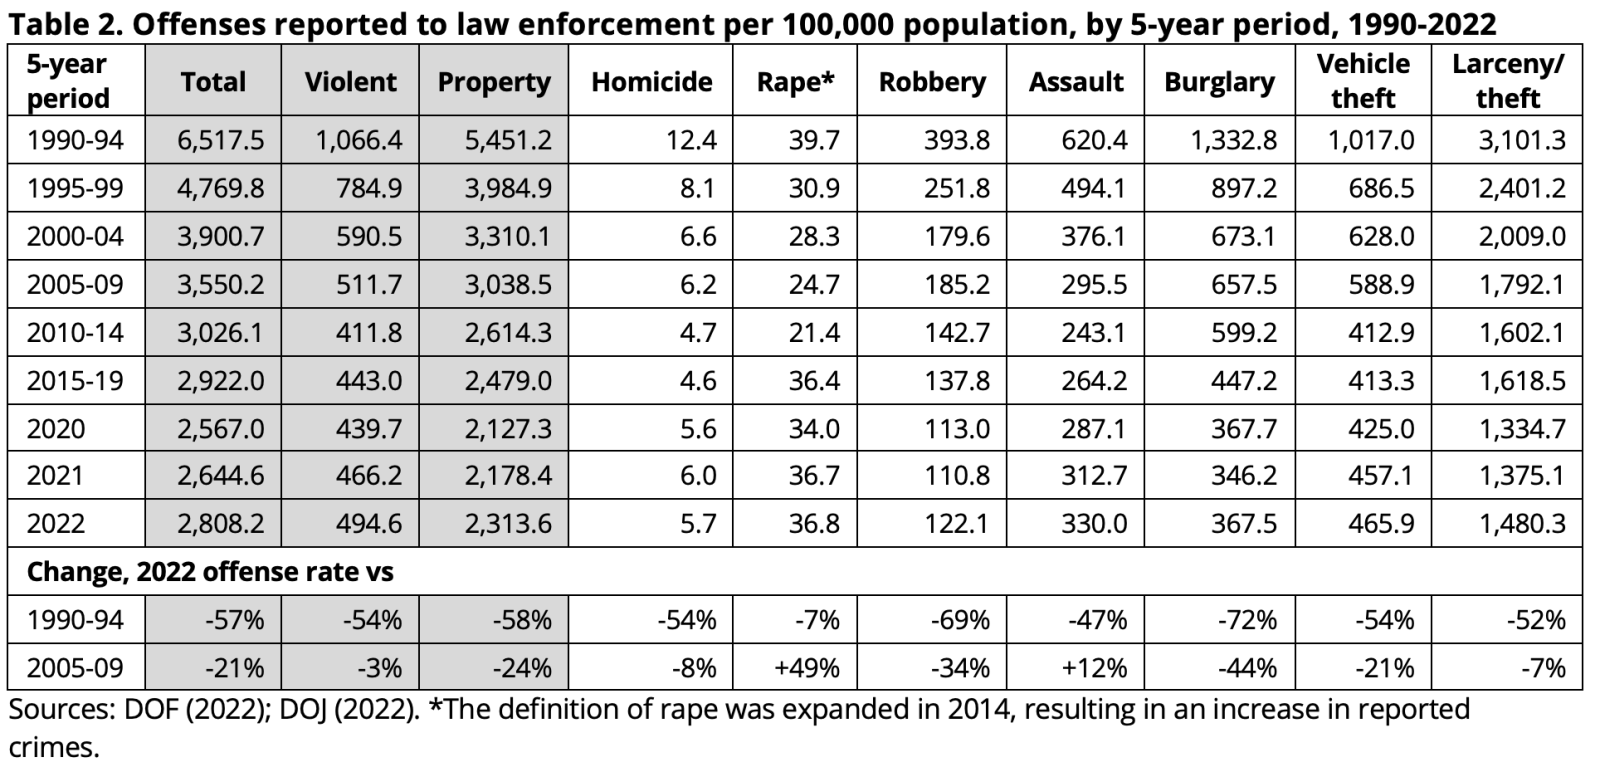
One might think the decline in rape, assault, and property offense clearances would be due to rising reports of these offenses overwhelming police resources, but the opposite is the case (Table 2). Reports of all major offenses have plummeted by 57% since 1990 – 94 and by 21% since 2005-09. This shows other factors must explain law enforcement’s increasing inability to solve crime. More crime and lack of police resources cannot explain this trend.
Nor is law enforcement concentrating on other offenses. Arrests for drug, public order, misdemeanor, status, and all other non-Part I offenses fell from 1,621,712 in 1990 to just 624,455 in 2022, a 61% decline. Reported cases are not available for these offenses, so no clearance rates can be calculated.
- Clearance rates have fallen despite rising law enforcement budgets
Law enforcement agencies are not being hampered by decreased funding and personnel. In fact, law enforcement agencies currently have larger budgets and staffing (even after factoring in inflation and California’s population growth) but solve fewer crimes than in the past. As Table 3 shows, per-capita spending on law enforcement (adjusted for inflation) rose by 46% from the early 1990s through 2022. Yet, during this period, the percentage of reported Part I offenses cleared by an arrest fell by 38%. These trends cast doubt on whether increasing police budgets and staffing would solve more crime.
- Declining law enforcement crime-solving, not reforms or DAs, are leaving fewer crimes resolved
The upshot is that law enforcement agencies are presenting prosecutors and community programs with far fewer people to process today than in the past. In 1990 – 94, police agencies cleared an average of around 423,000 Part I offenses per year, including 152,000 violent and 270,000 property offenses. In 2022 — in a state with 10 million more people and 45,000 more law enforcement personnel — police agencies cleared just 144,000 Part I offenses, including 79,000 violent and 65,000 property offenses. These declines in crime and crime-solving are the principal contributors to the massive declines in court, prosecutor, and probation caseloads, as well as sizable cuts in prison and jail populations.
- Clearance rates vary widely by jurisdiction, with no clear relationship to county crime rates
California’s 58 counties, each with multiple law enforcement agencies, have widely varying crime clearance rates. California cities, even large ones, and unincorporated areas vary even more widely. Among California’s major urban counties, Part I offense clearance rates in 2022 ranged from a high of 26.0% in Tulare County, 21.5% in Sonoma County, and 19.9% in San Bernardino County to a low of 6.7% in San Francisco and 5.8% in Alameda County, the latter driven by the Oakland Police Department’s very low clearance rate (1.5% in 2022 for all Part I offenses, including just 6.5% of violent offenses).
Law enforcement agencies need to explain why crime clearances have been falling since 1990 despite police agencies being given more resources and personnel. If, as is widely speculated, officers secretly stopped making arrests to protest reforms and coerce public sentiment against “liberal” policies, that would be a criminal dereliction of the police duty and oath that demands disciplinary action. The lawful way for police to protest policy is not to shirk their duties, but to make their case in policy forums or by running for office, like all other community members. Alternatively, if law enforcement has become less competent in solving crimes despite receiving more money and personnel, or if for some reason crimes have become harder to solve, these matters also require scrutiny so that corrective actions can be taken.
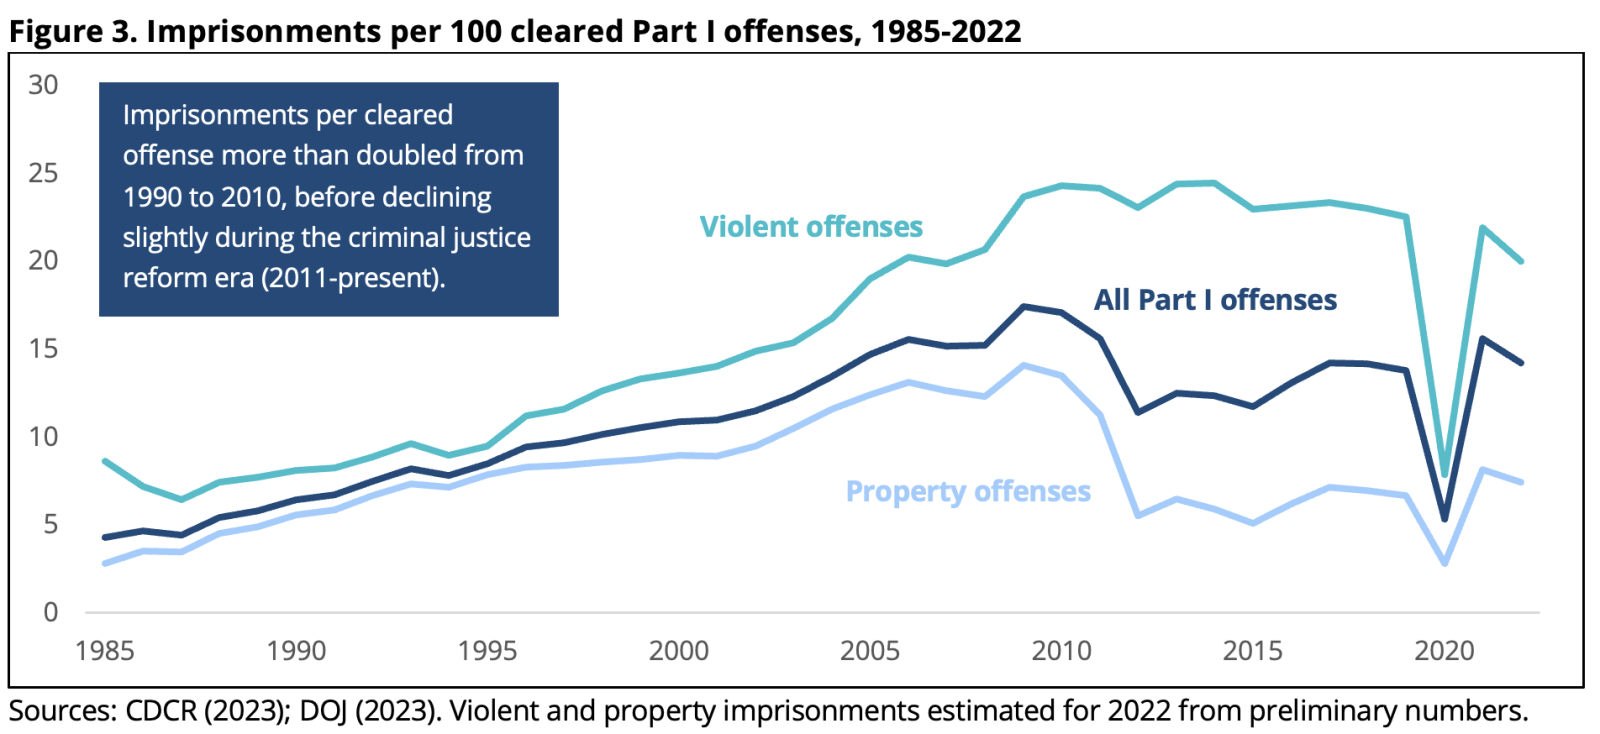
- The odds of imprisonment per cleared case have increased, not decreased, over the last 35+ years
The impression, often fostered by anti-reform lobbies, that individuals are “getting away with crime,” fails to account for the large drop in people who are arrested for reported Part I offenses. It is a myth that criminal justice reforms render a person arrested for a Part I offense less likely to be incarcerated for that offense than in years past (see Rodriguez, 2021). The opposite is true. In fact, a Part I offense cleared by arrest is more likely to result in a prison admission today than it has for any of the past 36 years, excepting 2009 and 2010.
In 2010, just prior to the start of the criminal justice reform era, there were 36,067 prison admissions for violent and property offenses, a rate of 17.1 prison admissions per 100 cleared Part I offenses (Figure 3). This rate is more than double 1990’s when 439,065 total Part I offenses were cleared by arrest and 28,122 people were admitted to prison for violent and property offenses, equal to 6.4 prison admissions per 100 cleared Part I offenses (Figure 2). In 2021 and 2022, there were more than 14 violent and property prison admissions per 100 cleared Part I offense, more than double 1990’s rate.
These trends complicate California’s progress towards remedying unconstitutional and inhumane prison overcrowding. While it is true that reduced law enforcement clearance rates aid in reducing prison populations, reducing prison populations should be accomplished by targeted policy, not by the haphazard failure to make arrests. The proper way to reduce prison populations is via legislated reforms such as Public Safety Realignment (AB 109), which, beginning in 2011, successfully reduced prison admissions for non-violent and non-serious offenses to comply with these court mandates. In 2020, COVID-19 restrictions brought steep but short-lived reductions in prison admissions, followed by a sharp reversal in 2021.
- Declining clearance rates, not reforms, drove down new prison admissions for property offenses
Opponents have criticized Proposition 47, as well as “liberal” prosecutors, as too lenient towards people who have committed serious property offenses (Washburn, 2022). However, police clearance data suggest that this blame is misplaced. In fact, while prison admissions for property offenses did fall by 24% from 2014 (just before Proposition 47 took effect) to 2022, much of the responsibility for this decline lies with police departments whose felony property crime clearance rates fell even faster (by 50%) during the period. In fact, the likelihood of prison admissions per cleared property offense rose by 13% from 2014 to 2019, the latest year before COVID-19 restrictions temporarily reduced new prison admissions. Imprisonment rates per property offense rebounded in 2022 to levels 26% higher than 2014.
- Property offense clearances were falling long before the justice reform era
Law enforcement clearances for property crimes did not decline because the California legislature raised the felony limit for thefts from $400 to $950 in 2010 (see Method).4Three-fourths of California’s law enforcement jurisdictions had declines in clearances of property offenses from 1990 to 2010, prior to the post-2010 reforms (DOJ, 2022). Moreover, from 2010 to 2019, dozens of the state’s 258 major law enforcement agencies (those with 500 or more reported Part I property offenses every year) reported increased property offense clearances. These cities include Berkeley, Eureka, Porterville, Santa Cruz, and Walnut Creek. Cities with thousands of reported property crimes each year increased their property offense clearance rates (often substantially) under the reformed felony theft limits.
Conclusion
California’s criminal justice debaters are arguing over the wrong things. Anti-reform lobbies, police officials and unions, and many press reports wrongly criticize criminal justice reforms and progressive district attorneys for failing to hold people accountable for crime. In part, the rapid rise in law enforcement budgets is the result of lobbying efforts by police unions and advocacy groups. These groups have been able to vastly expand the share of public funds allocated to law enforcement agencies. Yet, even with substantial increases in police funding, California has failed to see a return on its investment.
In stark contrast to California’s $25.5 billion annual investment in law enforcement, many community programs are addressing the root causes of crime and violence at a fraction of the cost. For example, evaluations of Proposition 47’s behavioral health, housing, and employment programs, which receive roughly 1/200th as much funding as law enforcement each year, show strong returns on a relatively modest investment. Participants of Proposition 47-funded services see lower rates of recidivism and homelessness and higher rates of employment after completing the program (Washburn, 2022).
True reform requires targeted strategies like these that address people’s underlying needs through housing support, education, mental health services, drug treatment, and more. Heavily investing in police is not working. Instead, jurisdictions should explore alternatives to policing for those problems other community organizations and agencies are better positioned to address.
Method
For each of the seven major Part I offenses (four violent and three property) used to form an “index” of crime, police report how many offenses are cleared (solved) by the arrest of a suspect. Crime clearances approximate but do not equal arrests, since one arrest may clear several offenses, or several arrests may clear just one, and later investigation may change initially reported clearances.
Clearance rates are an imperfect indication of the percentage of crimes that police “solve.” A crime is considered cleared by law enforcement if an arrest was made. An adjudication of guilt by a court is not necessary for a crime to be considered cleared. Occasionally, a law enforcement agency will designate a crime as cleared by “exceptional means” without an arrest, for instance, if a suspect was identified but died before an arrest could be made.
Since 1872, state law has contained protections against warrantless arrests for misdemeanors unless the misdemeanor was committed in the presence of the arresting officer. Police can address suspected misdemeanor law violations by reporting the incident to prosecutors. (This is called an “application for a complaint.”) But long-standing law that protects citizens from warrantless misdemeanor arrests unless they committed a crime in the presence of someone authorized to make an arrest – combined with defining clearances primarily by arrest – means that clearance rates for some misdemeanors will be low.
California’s broad protections against warrantless misdemeanor arrests are as old as the state itself, but the definition of some property crimes has had to change due to inflation. In 1982, the legislature decided that thefts of items valued at $400 or more ($1,260 in today’s dollars) should be considered a felony. That $400 threshold stood for a generation. In 2011, the California Legislature changed the threshold for Grand Theft from $400 to $950 to account for inflation. As a result, thefts of items valued from $400-$949 became misdemeanors; this change affected clearance rates for whatever share of thefts were of items valued in that range. These changes in law – intended to keep punishments up to date with inflation – likely affected clearance rates for thefts of items valued between $400 and $949. The full impact of these changes on clearance rates should be observable at the dates of their implementation: some of the change between 2011 and 2012, for instance, is likely due to the update in law. Outside of these years, changes in clearance rates are entirely due to changes in police practices or police data reporting.
Within the years affected by changes in law, it is not possible to determine the major drivers of changes in clearance rates because law enforcement agencies in the state declined to update their data definitions to match existing law. Police still use the $400 threshold and have declined to update their reporting to match California’s laws since 1982.
In 2022, crime clearance rates were reported by 718 law enforcement agencies to the California Department of Justice (DOJ) (2023). DOJ releases these data publicly, allowing for an analysis of crime solving by local police, county sheriffs, specialized agencies such as transportation, park, campus, and other police, and state police agencies like the California Highway Patrol. Summing clearances produces totals for all 58 counties and a statewide clearance rate.
A clearance rate analysis is only as accurate as the data used to produce it. These data, like crime statistics more broadly, are produced by police agencies themselves and subject to reporting errors and, in some cases, distortion. A charting of clearance rates for 1985 – 2022 for the state’s five largest cities, which should have the most stable numbers, instead reveals extremely erratic patterns. In Sacramento and San Jose, violent crime clearance rates varied by 30 points over a period of one year, while variations of 10 points or more in a one-year period occurred for Los Angeles, San Diego, and San Francisco. Property crime clearance rates also proved unstable. It may be that law enforcement agencies are not capable of generating reliable crime statistics, indicating their gathering and reporting should be shifted to another public agency.
Reported offenses and clearances by jurisdiction are available for the 1985 – 2022 period (DOJ, 2023). This report uses post-1990 numbers. Populations for each incorporated jurisdiction for 2020 are from California Department of Finance (2023) estimates, which allow calculation of offense rates. Results are reported for each county, selected cities and unincorporated areas, and cities of 100,000 population or more.
References
Bureau of State and Community Corrections (BSCC). (2023). Jail profile survey. Juvenile detention profile survey. At: http://www.bscc.ca.gov/m_datar….
California Highway Patrol, Department of (CHP) (2023). Ebudget. At: https://ebudget.ca.gov/2023-
24/pdf/GovernorsBudget/2500/2720.pdf
California Office of the Controller (Controller) (2023). City data. At: https://cities.bythenumbers.sc…. County data. At:
https://counties.bythenumbers.…. Budgetary/Legal Basis Annual Report. At: https://www.sco.ca.gov/ard_sta….
California Department of Corrections (CDCR). (2023). Offender data points. At https://www.cdcr.ca.gov/resear…. California Prisoners and Parolees. At: https://www.cdcr.ca.gov/resear…. Special data provision by request for 2020. 2021, and 2022.
California Department of Finance (DOF). (2023). Demographic Research Unit. Estimates. At: https://dof.ca.gov/forecasting….
California Department of Industrial Relations (DIR). (2023). California Consumer Price Index, (1955−2022). At: https://www.dir.ca.gov/OPRL/CP….
California Department of Justice (DOJ). (2023). Crime in California, 1985 – 2022. At: https://openjustice.doj.ca.gov…. https://openjustice.doj.ca.gov….
California Senate Committee on Public Safety (2010). AB 2372 Bill Analysis, June 29, 2010, www.leginfo.ca.gov/pub/09 – 10/b…. https://leginfo.legislature.ca….
Pew Charitable Trusts. (2017). The effects of changing felony theft thresholds. At: https://www.pewtrusts.org/~/me…
.
Prison Policy Initiative. (2020). How inflation makes your state’s criminal justice system harsher today than it was yesterday. At: https://www.prisonpolicy.org/b….
Public Policy Institute of California (PPIC). (2020). How much do cities spend on policing? At: https://www.ppic.org/blog/how-….
Rodriguez, S. (2022). What compels Republicans and police to lie about Proposition 47? Orange County Register, February 18, 2022. At: https://www.ocregister.com/202…about-proposition-47.
Sacramento Bee (12 Nov 2023). Sacramento County sheriff accuses major retail stores of stymieing efforts to stop theft. At: https://www.sacbee.com/news/lo…
Washburn, M. (2022). Proposition 47: A $600 million lifeline to California communities. Center on Juvenile and Criminal Justice. At: http://www.cjcj.org/uploads/cj…es.pdf.
Please note: Jurisdictions submit their data to the official state or nationwide databases maintained by appointed governmental bodies. While every effort is made to review data for accuracy and to correct information upon revision, CJCJ cannot be responsible for data reporting errors made at the county, state, or national level.
Media Coverage & Response
We are pleased with the response to our most recent report California Law Enforcement Agencies Are Spending More But Solving Fewer Crimes. Media and partner coverage underscores the urgency of this information and the questions the data poses.
Contact: For more information about this topic or to schedule an interview, please contact CJCJ Communications at (415) 621‑5661 x. 103 or cjcjmedia@cjcj.org.
- 1 This includes the California Highway Patrol, county sheriff’s departments, and local police agencies. ↩
- 2 Part I felonies include murder, rape, aggravated assault, robbery, burglary, motor vehicle theft, and larceny/theft. Larceny/theft is the only Part I offense to include misdemeanors (see Method). ↩
- 3 Law enforcement agency budgets are in constant 2022 dollars adjusted for inflation and state population growth. ↩
- 4 Note: Even with a narrower definition of felony theft, California is not lenient; it has the country’s 11th strictest threshold for felony theft among the 51 states and DC (Prison Policy Initiative, 2022). California is not staking out a radical position; it merely joined the large majority (37) of states that raised their felony theft thresholds from 2000 to 2016 to higher levels (Pew, 2017). Raising the grand theft threshold from $400 to $950 only partially compensated for the effects of four decades of inflation in artificially expanding felony offenses. An item worth $950 whose theft would be a felony in 2021 would have been worth less than $400 prior to 1982 resulting in only petty theft charges for stealing that same item back then. As a result, inflation had boosted the proportion of larceny/thefts classed as felonies from 27% in 1990 to 41% in 2014. Felonies should only be expanded by direct legislative action, not by the passive effects of non-legislative forces such as inflation. ↩