Overview Cameo House Community Options for Youth (COY) Detention Diversion Advocacy Program (DDAP) Expert Witness, Court Navigation, & Sentencing Mitigation Services Juvenile Collaborative Reentry Unit (JCRU) No Violence Alliance (NoVA) Overview Technical Assistance California Sentencing Institute Next Generation Fellowship Legislation Transparency & Accountability

Introduction

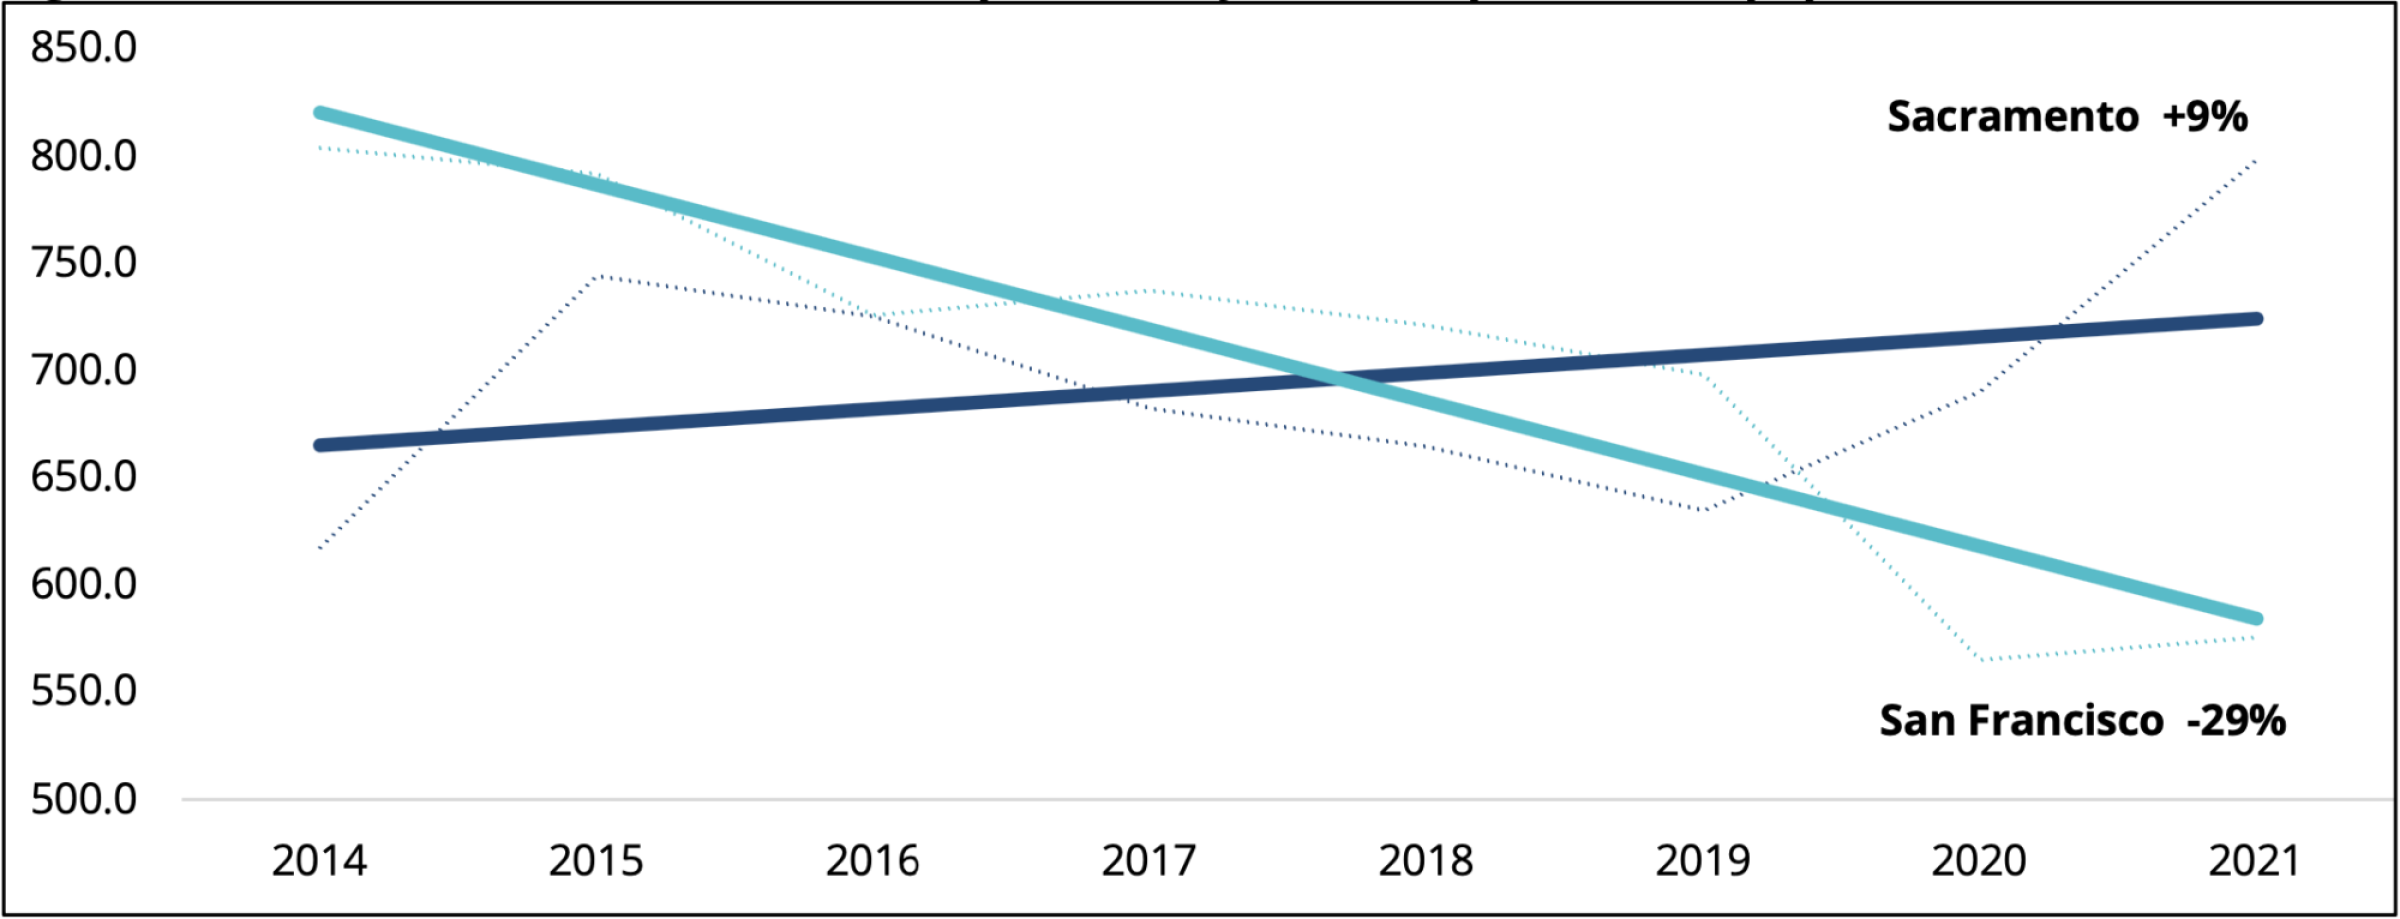
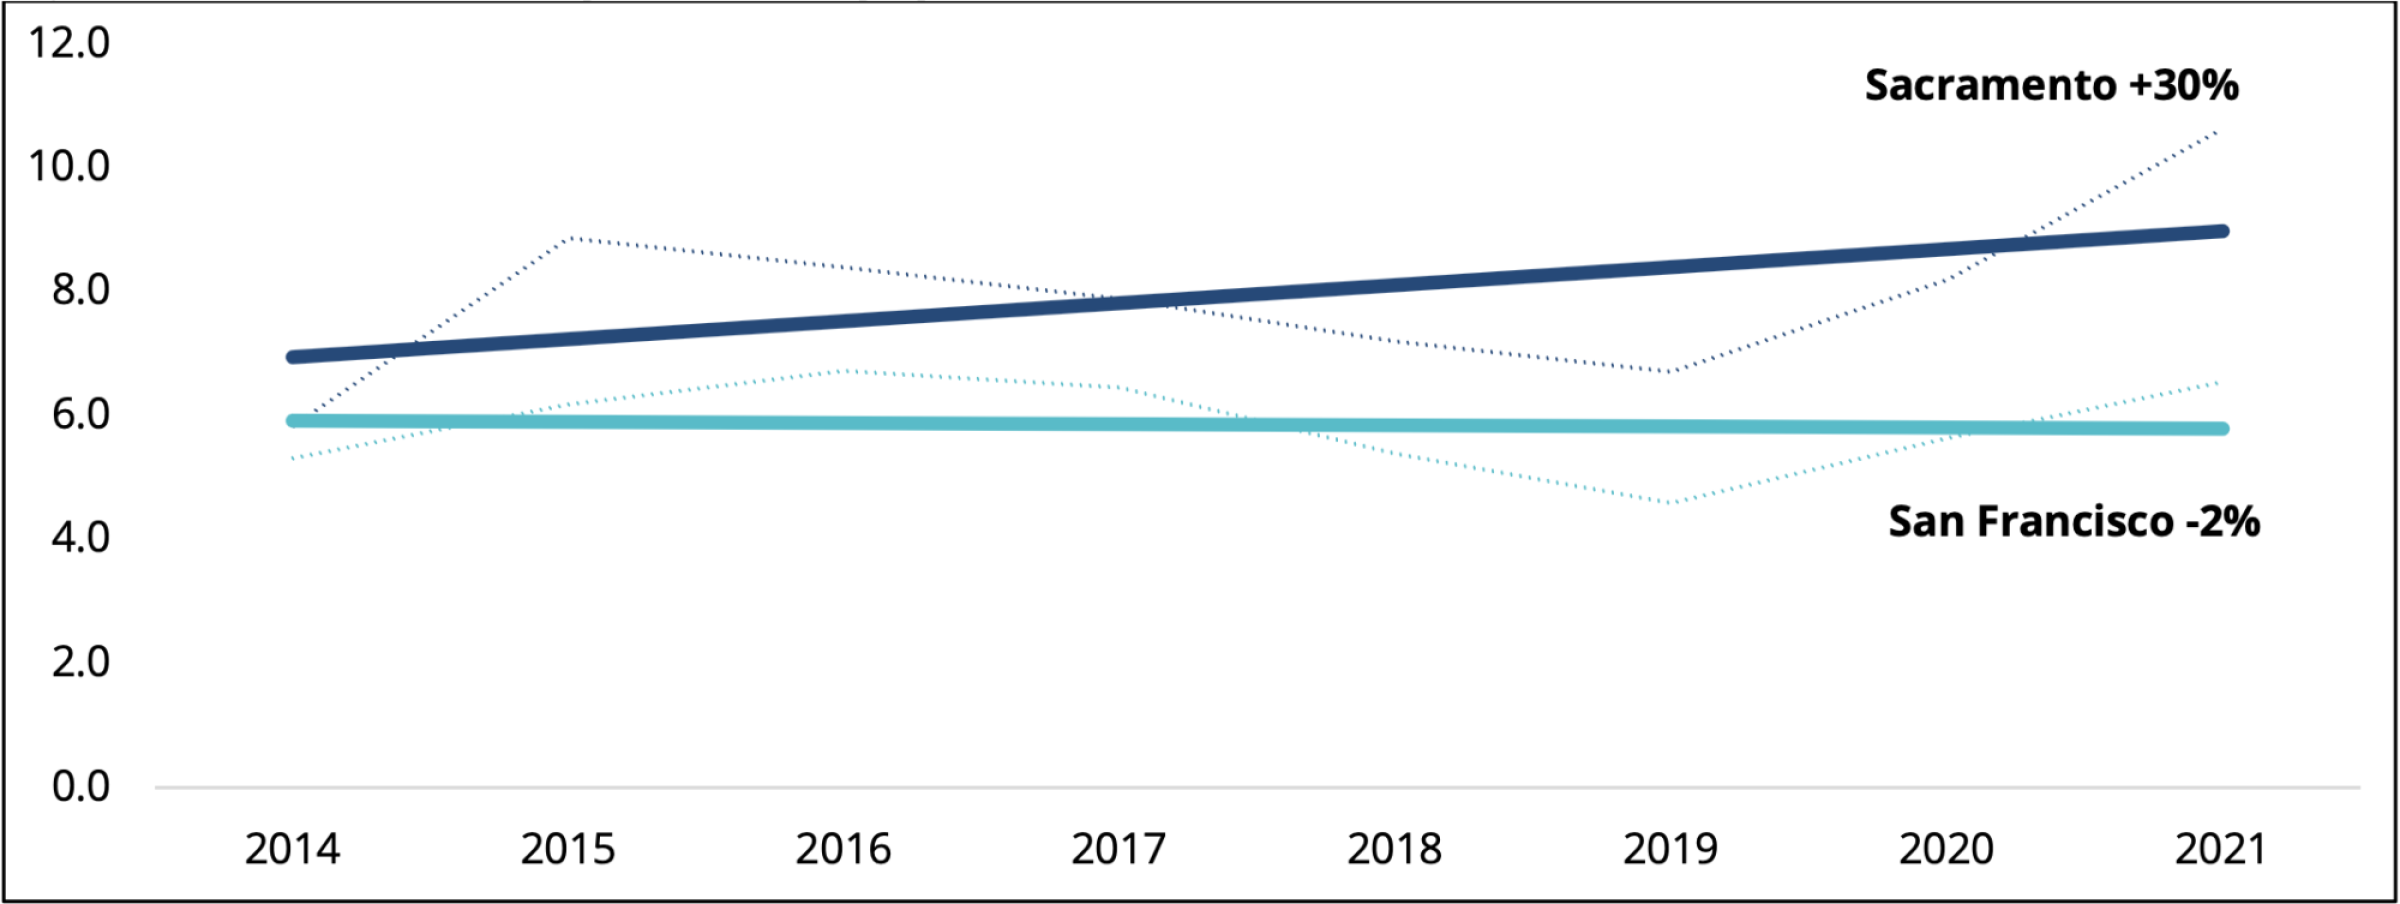
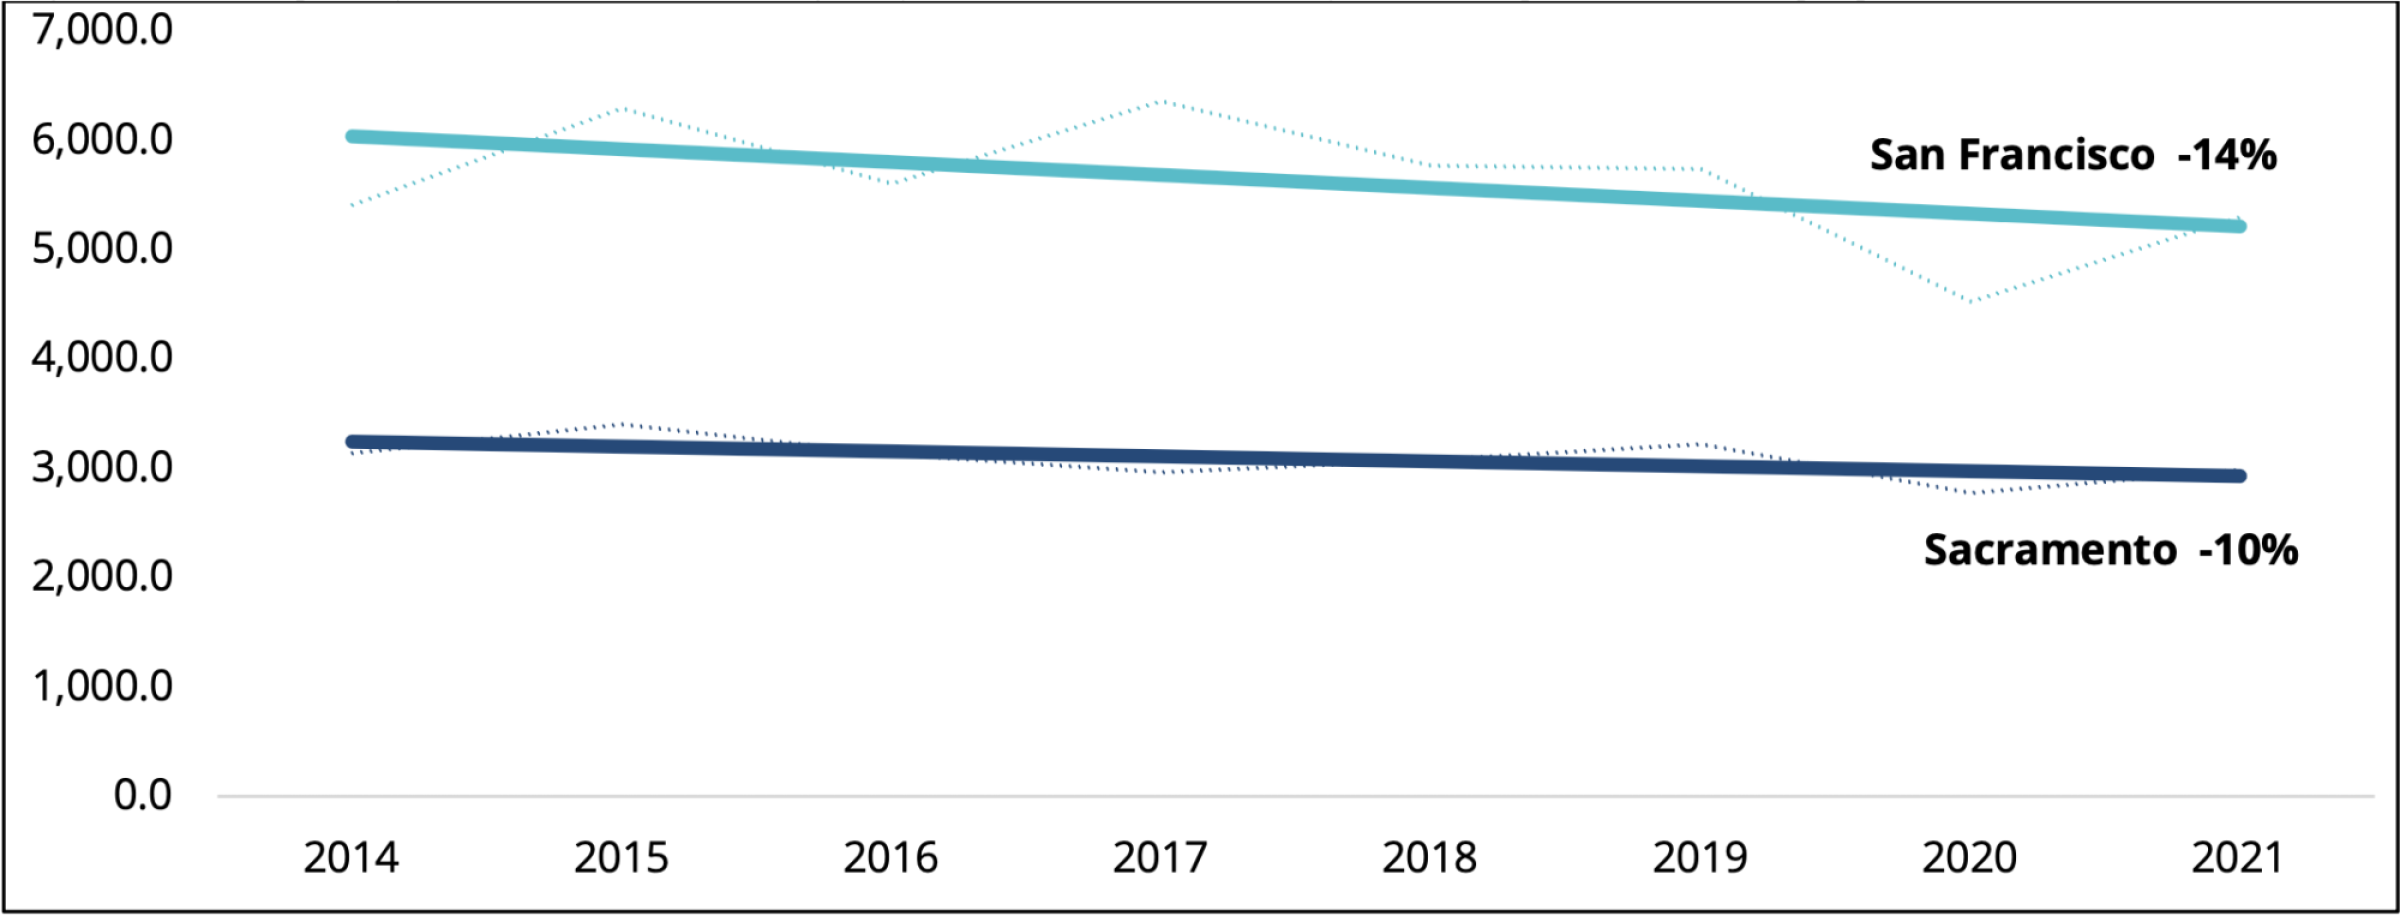
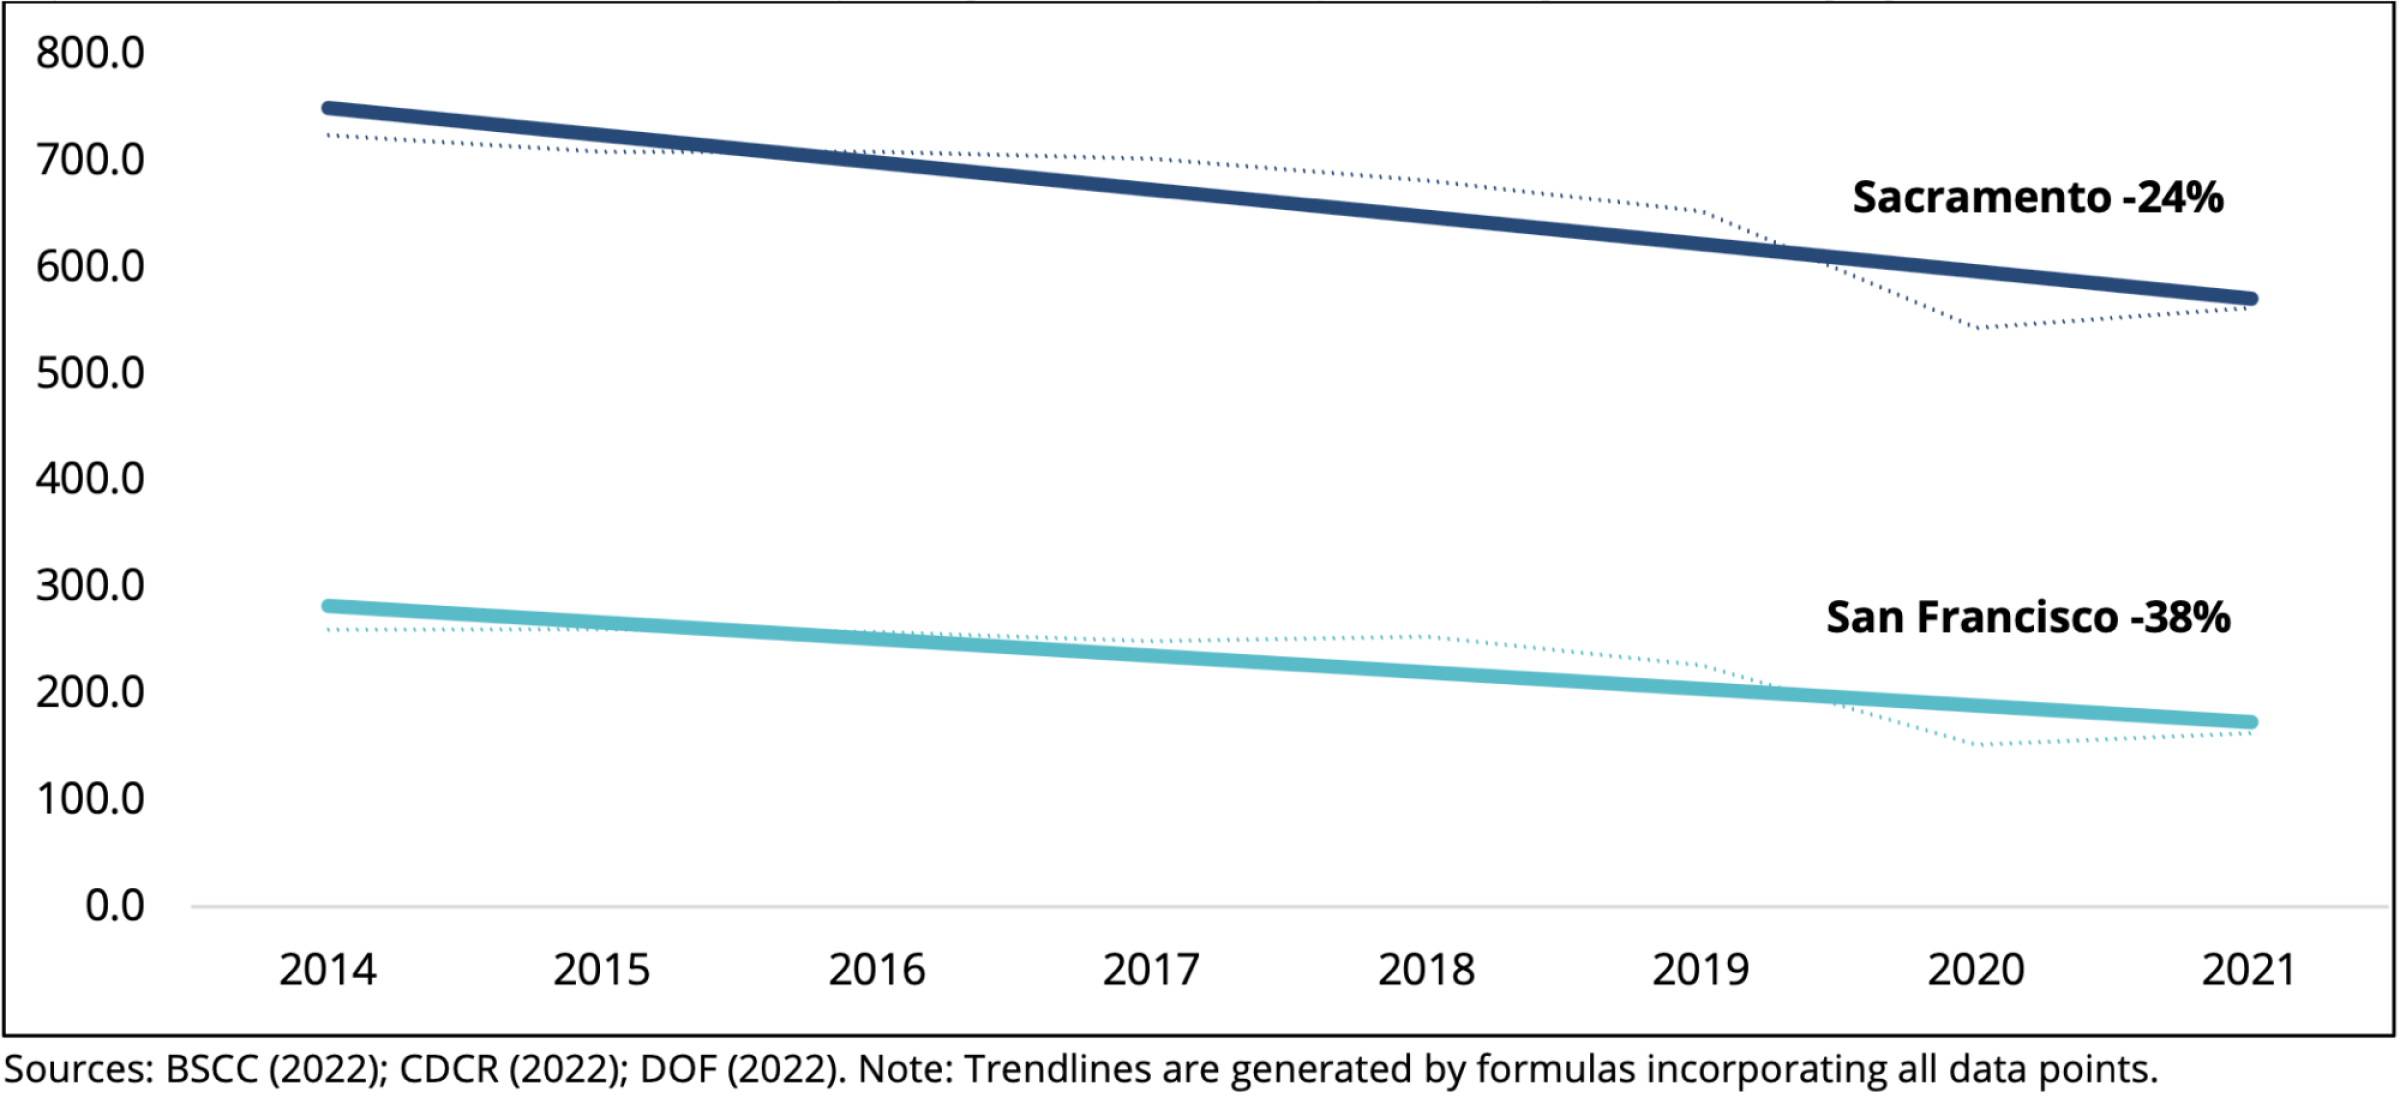
San Francisco has seen major decreases in crime amid progressive reforms, while nearby Sacramento is seeing a homicide and violence surge under the leadership of a conservative prosecutor whose policies feature high rates of incarceration. Sacramento District Attorney Anne Marie Schubert has positioned herself as the state’s leading tough-on-crime” candidate as she criticizes progressive San Francisco DA Chesa Boudin and seeks to unseat California’s reform-minded Attorney General Rob Bonta (Hooks, 2021; Schubert, 2022). Yet DA Schubert’s tenure has coincided with increased homicide and violent crime, lesser declines in property crime, and above average rates of homicide and violent crime for urban Sacramento than in San Francisco. Schubert’s tough on crime” rhetoric and policies have not delivered lower or falling crime rates.

This analysis compares crime trends during Schubert’s conservative prosecutorial term in office (2015- present) with those of San Francisco’s progressive prosecutors (George Gascón and Chesa Boudin) during a key period in California’s criminal justice reform era. If talking tough on crime” and incarcerating more people actually reduced crime, we would expect to see a much bigger decline in crime and a lower crime rate in Sacramento than in San Francisco. In fact, the opposite is the case. San Francisco has sustained larger crime declines and achieved lower rates of violent crime than the City of Sacramento since 2014.

Findings: Crime and incarceration fall in San Francisco while Sacramento’s trends worsen

The results1, shown in Figures 1 through 4 and Tables 1 and 2, show distinct patterns:

  • During the 2014 – 2021 period bracketing Schubert’s term, rates of homicide, other violent crimes, and property crimes, fell faster in San Francisco than in Sacramento even as San Francisco reduced its incarceration rate (-38%) much faster than did Sacramento (-24%). While Sacramento had lower violence rates before Schubert’s term, rates have risen 9 percent on average, surpassing San Francisco’s.
  • Today, the City of Sacramento has higher rates of violent crime, including for homicide, rape, and aggravated assault, while San Francisco’s violent crime rate has plunged to record-low levels. San Francisco has higher reported rates of robbery, burglary, and thefts, which reflect a long-standing historical pattern deriving from its high retail density and tourist visitation.
  • The San Francisco Police Department (SFPD) solves a far smaller share of reported crimes than police in any major California city, presenting the DA with fewer cases to prosecute. Sacramento DA’s office receives a much higher proportion of reported cases from local police departments, particularly for violent offenses.
  • Sacramento County’s heavy reliance on imprisonment cost California taxpayers $151.6 million, while San Francisco’s progressive approach saved the state $163.3 million.

Figure 1. Violent crime rates (homicide, rape, robbery, assault) per 100,000 population, 2014 – 2021

Figure 2. Homicide rates per 100,000 population, 2014 – 2021

Figure 3. Property crime rates (burglary, MV theft, larceny/​theft) per 100,000 population, 2014 – 2021

Sources for Figures 1 – 3: City of Sacramento (2022); DOF (2022); DOJ (2021); SFPD (2022). Note: Trendlines are generated by regression formulas incorporating all data points. City of Sacramento rates are based on Sacramento Police Department (2022) reports of crime changes for the first 11 months of 2021 versus the first 11 months of 2020.

Table 1. Reported offenses cleared by arrest, Sacramento vs. San Francisco police departments, 2020

CityHomicideRapeRobberyAggravated AssaultBurglaryVehicle TheftLarceny/Theft

Sacramento

71%

33%

33%

43%

12%

11%

4%

San Francisco

75%

19%

25%

37%

11%

9%

4%

Source: DOJ (2021).

The San Francisco Police Department (SFPD) cleared just 30.7 percent of the violent offenses and 6.0 percent of property offenses in 2020, compared to 40.7 percent and 6.5 percent, respectively, cleared by the Sacramento Police Department (SPD). The SFPD is better at clearing homicide, while SPD is more effective in clearing nearly all other offenses (Table 1). Claims in media reports that DAs must get tough” on shoplifters ignores the fact that over 90 percent of such larcenies/​thefts do not result in an arrest, even for the fraction of offenses that are reported to police. Overall, the Sacramento DA’s office receives a much higher proportion of reported cases from local police departments, particularly for violent offenses, than does the San Francisco DA’s office, which accounts for some of the disparity in incarceration rates.

Figure 4. Total incarceration rates (jail + prison, adult + juvenile) per 100,000 population, 2014 – 2021

Sacramento County incarcerates people at a level 37 percent above the state average, including rates of state imprisonment 36 percent higher and Division of Juvenile Justice incarceration nearly two times higher. San Francisco has an incarceration rate 60 percent below the state average, with a state imprisonment rate 74 percent lower and no youth in state DJJ facilities. Sacramento County’s above-average reliance on imprisonment in 2021 cost state taxpayers $151.6 million more than if the county imprisoned adults at the state average rates (DOF, 2022a). Sacramento’s dependence on state prison is particularly problematic in an era in which courts have mandated reductions in unconstitutional prison overcrowding. Meanwhile, San Francisco’s below-average rate of imprisonment saved California taxpayers $163.3 million in 2021 compared to costs if the county imprisoned adults at the state average.

Conclusion

If California is to move away from a simplistic debate on crime inflamed by sensational anecdotes, viral videos, false claims, and tough-talking cliches, political leaders and media reports must move toward consistent analysis of documentable trends. It is difficult to square Sacramento DA Schubert’s tough on crime” rhetoric with the actual record during her eight years in office, especially when compared to reform-oriented, often-criticized San Francisco (Table 2). The City of Sacramento’s violent crime rate is 39 percent higher, including a homicide rate 62 percent higher, than San Francisco’s. Sacramento also has considerably higher rates of rape and assault, as well as either greater increases or lesser declines in both violent and property crime, than does San Francisco.

It is also unclear why the press allows Sacramento’s officials to blame others for the City of Sacramento’s much higher violence rates and persistently worse crime trends while simultaneously criticizing San Francisco’s progressive district attorneys even for imaginary crime trends. San Francisco operates under the same statewide reforms and rules as Sacramento yet has sustained substantially better crime outcomes in key areas.

San Francisco does have property crime rates 77 percent higher than does Sacramento, as well as a higher rate of robbery, a violent crime involving taking property. San Francisco’s higher than average property and robbery crime rates have persisted for many decades due to the city’s high retail density and large numbers of tourists (the city’s reported property and robbery crimes peaked at 72,964 in 1992, falling to 49,195 in 2014, and to 47,552 in 2021). However, Sacramento’s recently elevated violent crime levels represent a resurgence from previously fluctuating numbers (reported violent crimes peaked at 5,556 in 2006, falling to 2,968 in 2014, and rising to a projected 4,117 in 2021). Sacramento’s violent crime rate went from below San Francisco’s rate before Schubert’s term to well above San Francisco’s rate during her term. This trend may be compounded by 2022 statistics, which will include Sacramento’s recent mass shooting (CapRadio, 2022). Normally, violent crime is a much more serious public and policy concern than property crime.

Table 2. Reported crime and incarceration rates per 100,000 population, 2021

Part I crime ratesSan Francisco city (2021)Sacramento city (2021)*

Violent crime rate

575.4

798.5

Homocide

6.5

10.7

Rape

25.7

31.4

Robbery

263.7

191.5

Aggravated assault

279.5

564.9

Property crime rate

5,294

2,994.9

Burglary

854.5

479.6

Vehicle theft

709.5

619.3

Larceny

3,730.3

1,896.0

Incarceration rate (county-wide)

162.8

561.9

State prison

65.1

339.0

Local jail

97.7

212.2

Population (cities only)

855,550

515,673

Sources: BSCC (2022); City of Sacramento (2022); CDCR (2022); DOF (2022); DOJ (2021); SFPD (2022). Note: City of Sacramento rates are based on Sacramento Police Department (2022) reports of crime changes for the first 11 months of 2021 versus the first 11 months of 2020.

Moving beyond simplistic sensationalism requires examining the complexities of crime levels and trends. First, if institutional blame is to be assigned, it should be pointed out that the Sacramento Police Department clears a higher proportion of reported violent and property offenses and thus presents the DA with more cases to prosecute than does the San Francisco Police Department. SFPD must bear primary responsibility for any impression, justified or unjustified, that the city does not exact accountability for serious crime.

Second, Sacramento’s high-imprisonment policies are heavily subsidized by state taxpayers, while San Francisco’s low-incarceration policies reflect local self-reliance. When presented with the realistic costs of returning to high-imprisonment policies absent evidence of their effectiveness in reducing crime, California voters and recent governors of both parties consistently have rejected them in favor of a series of reforms.

Third, structural conditions in both cities predict crime patterns far more than do DA policies. San Francisco’s much higher per-capita income ($68,883 in 2021) compared to Sacramento’s ($31,956) (U.S. Census Bureau, 2022) typically predicts lower homicide and violent crime rates. In turn, conditions in San Francisco predict higher property crime opportunities and rates. These include a high retail density (1.09 million retail square feet per square mile, second nationally only to Manhattan), high visitor presence (30,000 to 70,000 non- residents in the city, around five times Sacramento’s per-capita visitor volume) (Cushman & Wakefield, 2019; Males, 2021a), and the proliferation of high-end retail outlets and vehicles to burglarize. Debating crime policy based on more substantive information than viral videos and sound-bite cliches is the imperative for 2022 and beyond.

References

Board of State and Community Corrections (BSCC) (2022). Jail profile survey. Juvenile detention profile survey. At: http://​www​.bscc​.ca​.gov/​m​_​datar….

California Department of Corrections and Rehabilitation (CDCR) (2022). Prisoners by county. Division of
Juvenile Justice populations by county. Special data requests provided by CDCR. California Department of Finance (DOF). (2022). E‑4 Population Estimates for Cities, Counties, and the State, 2011 – 2020 with 2010 Census Benchmark. At: https://​www​.dof​.ca​.gov/​f​o​recas….

California Department of Finance (DOF). (2022a). Governor’s Budget, 2022 – 23. At: https://​www​.ebud​get​.ca​.gov/202.

California Department of Justice (DOJ). (2021). Open Justice. Arrests. At: https://​open​jus​tice​.doj​.ca​.gov….

California Department of Justice (DOJ). (2021a). Crimes and Clearances. At: https://​open​jus​tice​.doj​.ca​.gov….

CapRadio. (2022). Downtown Sacramento shooting: What we know and latest updates. At: https://​www​.capra​dio​.org/​artic….

City of Sacramento. (2021). FY 2019 – 20 city budget, p. 221. At: https://www.cityofsacramento.o…
/​media/​Corporate/​Files/​Finance/​Budget/​2019 – 2024-Proposed-Budget/FY20-Proposed_FINAL.pdf?la=en.

City of Sacramento, Police Department (2022). Crime and Statistics (figures available for January-November 2021 at this writing are prorated to entire year). At: http://www.cityofsacramento.or….

Hooks, K. (2021). Sacramento DA Anne Marie Schubert to challenge Attorney General Rob Bonta for job in 2022. CapRadio, April 26, 2021. At: https://​www​.capra​dio​.org/​artic….

Males, M. (2021). The New York Times fabricates a nonexistent shoplifting wave in San Francisco, then wrongly blames it on criminal justice reforms and the city’s supposed soft-on-crime image. Center on Juvenile and Criminal Justice, June 9, 2021. At: http://​www​.cjcj​.org/​n​e​w​s​/​13165.

Males, M. (2021a). Herd journalism and the phony San Francisco shoplifting epidemic’. Center on Juvenile and Criminal Justice, December 22, 2021. At: http://​www​.cjcj​.org/​n​e​w​s​/​13219.

San Francisco Police Department (SFPD). (2022). Crime Dashboard – 1/1/2021 through 12/31/2021. At: https://www.sanfranciscopolice…. Accessed 5/31/2022.

Schubert, Anne Marie, for Attorney General (2022). Priorities. At: https://​annemariefor​ag​.com/pri….


Please note: Jurisdictions submit their data to the official statewide or national databases maintained by appointed governmental bodies. While every effort is made to review data for accuracy and to correct information upon revision, CJCJ cannot be responsible for data reporting errors made at the county, state, or national level.

Contact: For more information about this topic or to schedule an interview, please contact CJCJ Communications at (415) 6215661 x. 103 or cjcjmedia@​cjcj.​org.

  • 1 San Francisco, which consists wholly of a city with no suburban and rural population, most resembles the City of Sacramento. This report provides comparisons of reported Part I felony violent and property crimes, arrest, and incarceration trends for San Francisco and the City and County of Sacramento, divided by their respective populations to produce annual rates. Rather than “cherry picking” base years to calculate changes in rates, this analysis uses a regression trendline that generates changes in rates incorporating all data points.