Since the release of our report California Law Enforcement Agencies Are Spending More But Solving Fewer Crimes, we have seen some false narratives being shared around crime in California. We fact checked those narratives below. We also created a resource entitled The Truth About Crime in California. Please read below, and download the resource to share with your networks.
False Narratives Fact Checked
We now have more officers per reported offense than we did 30 years ago. There are also fewer crimes to solve and new technologies to assist in crime-solving. We would expect police efficacy to be going up, not down. Yet crime clearance (solving) rates are at a historic low.
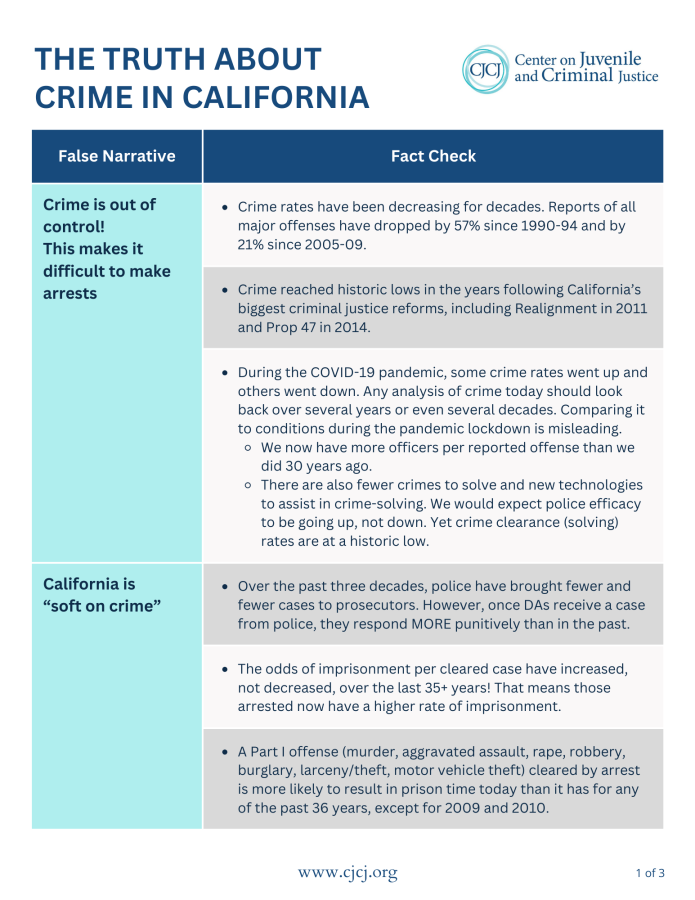
Crime is out of control! This makes it difficult to make arrests
Truth is:
- Crime rates have been decreasing for decades. Reports of all major offenses have dropped by 57% since 1990 – 94 and by 21% since 2005-09.
- Crime reached historic lows in the years following California’s biggest criminal justice reforms, including Realignment in 2011 and Prop 47 in 2014.
- During the COVID-19 pandemic, some crime rates went up and others went down. Any analysis of crime today should look back over several years or even several decades. Comparing it to conditions during the pandemic lockdown is misleading.
- We now have more officers per reported offense than we did 30 years ago.
- There are also fewer crimes to solve and new technologies to assist in crime-solving. We would expect police efficacy to be going up, not down. Yet Yet crime clearance (solving) rates are at a historic low.
California is “soft on crime”
Truth is:
- Over the past three decades, police have brought fewer and fewer cases to prosecutors. However, once DAs receive a case from police, they respond MORE punitively than in the past.
- The odds of imprisonment per cleared case have increased, not decreased, over the last 35+ years! That means those arrested now have a higher rate of imprisonment.
- A Part I offense (murder, aggravated assault, rape, robbery, burglary, larceny/theft, motor vehicle theft) cleared by arrest is more likely to result in prison time today than it has for any of the past 36 years, except for 2009 and 2010.
A Part I offense (murder, aggravated assault, rape, robbery, burglary, larceny/theft, motor vehicle theft) cleared by arrest is more likely to result in prison time today than it has for any of the past 36 years, except for 2009 and 2010.
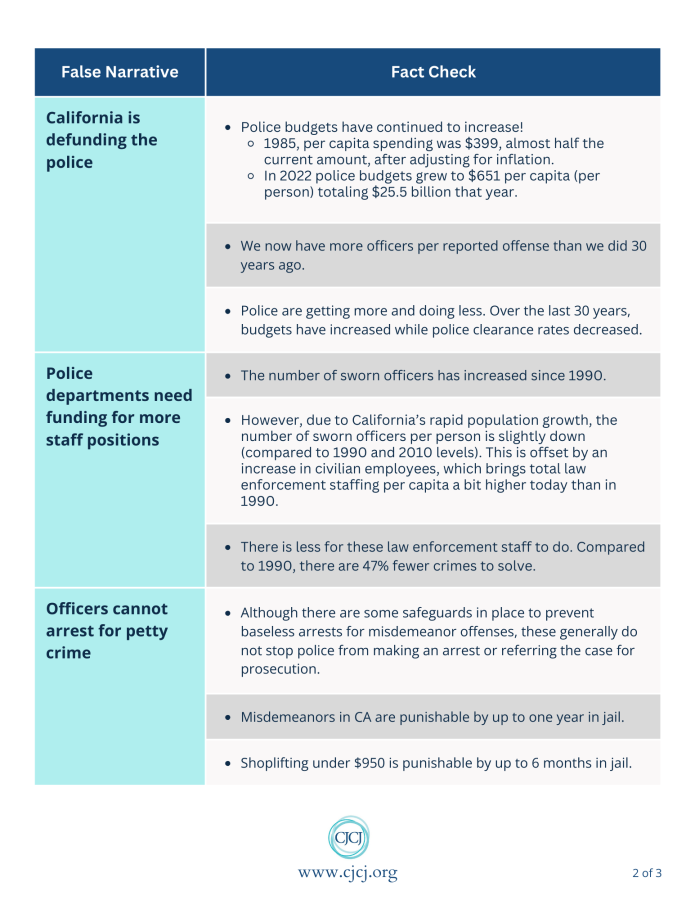
California is defunding the police
Truth is:
- Police budgets have continued to increase!
- 1985, per capita spending was $399, almost half the current amount, after adjusting for inflation.
- In 2022 police budgets grew to $651 per capita (per person) totaling $25.5 billion that year.
- We now have more officers per reported offense than we did 30 years ago.
- Police are getting more and doing less. Over the last 30 years, budgets have increased while police clearance rates decreased.
Police departments need funding for more staff positions
Truth is:
- The number of sworn officers has increased since 1990.
- However, due to California’s rapid population growth, the number of sworn officers per person is slightly down (compared to 1990 and 2010 levels). This is offset by an increase in civilian employees, which brings total law enforcement staffing per capita a bit higher today than in 1990.
- There is less for these law enforcement staff to do. Compared to 1990, there are 47% fewer crimes to solve.
There is less for these law enforcement staff to do. Compared to 1990, there are 47% fewer crimes to solve.
Officers cannot arrest for petty crime
Truth is:
- Although there are some safeguards in place to prevent baseless arrests for misdemeanor offenses, these generally do not stop police from making an arrest or referring the case for prosecution.
- Misdemeanors in CA are punishable by up to one year in jail.
- Shoplifting under $950 is punishable by up to 6 months in jail.
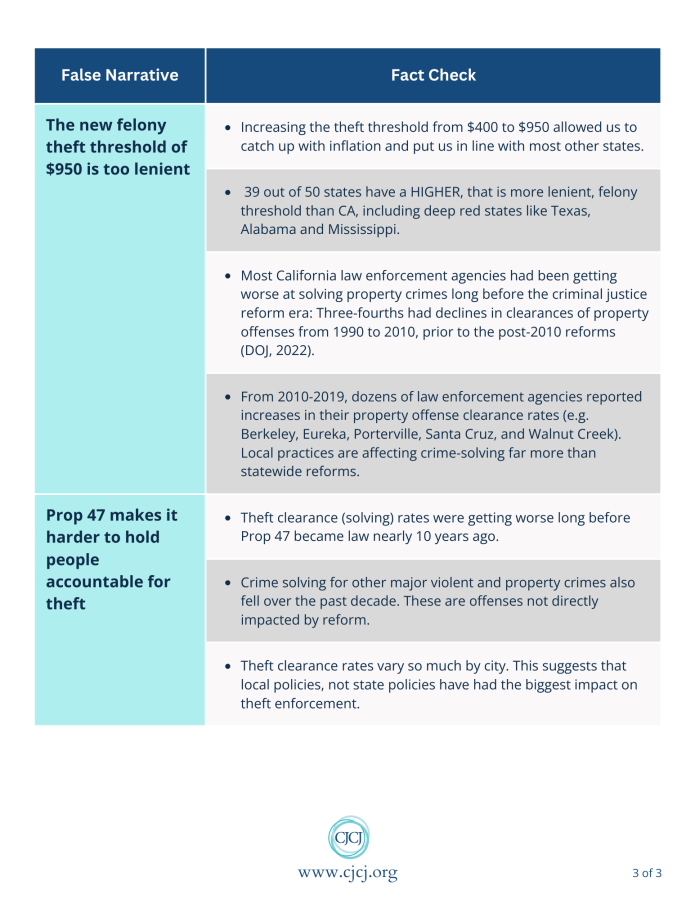
The new felony theft threshold of $950 is too lenient
Truth is:
- Increasing the theft threshold from $400 to $950 allowed us to catch up with inflation and put us in line with most other states.
- 39 out of 50 states have a HIGHER, that is more lenient, felony threshold than CA, including deep red states like Texas, Alabama and Mississippi.
- Most California law enforcement agencies had been getting worse at solving property crimes long before the criminal justice reform era: Three-fourths had declines in clearances of property offenses from 1990 to 2010, prior to the post-2010 reforms (DOJ, 2022).
- From 2010 – 2019, dozens of law enforcement agencies reported increases in their property offense clearance rates (e.g. Berkeley, Eureka, Porterville, Santa Cruz, and Walnut Creek).
- Local practices are affecting crime-solving far more than statewide reforms.
39 out of 50 states have a HIGHER, that is more lenient, felony threshold than CA, including deep red states like Texas, Alabama and Mississippi.
Prop 47 makes it harder to hold people accountable for theft
Truth is:
- Theft clearance (solving) rates were getting worse long before Prop 47 became law nearly 10 years ago.
- Crime solving for other major violent and property crimes also fell over the past decade. These are offenses not directly
impacted by reform. - Theft clearance rates vary so much by city. This suggests that local policies, not state policies have had the biggest impact on
theft enforcement.