Background
DJJ in transition
As part of CJCJ’s longstanding commitment to monitoring the health and safety of youth at California’s state youth correctional system, the Division of Juvenile Justice (DJJ), we have compiled a trove of otherwise unavailable reports. Since the spring of 2019, the state has not made these data public — a decision that has severely hindered efforts to monitor DJJ at a critical juncture. Governor Gavin Newsom has approved a plan to end most new admissions to DJJ beginning on July 1, 2021 and fully empty the institutions over the next several years. The data reports below can support this transition by providing decision-makers with current and historical information about DJJ’s youth population, their needs, and the programming required to serve them at the local level.
DJJ at a glance
Data Reports
COMPSTAT Operational Performance Measures provide data on DJJ’s population, staff use of force, violence, discipline, staffing, programming, healthcare, and more. These data are broken out by facility and provided on a monthly basis for July 2010 through June 2021.
July 2010-June 2020
June 2020-December 2020
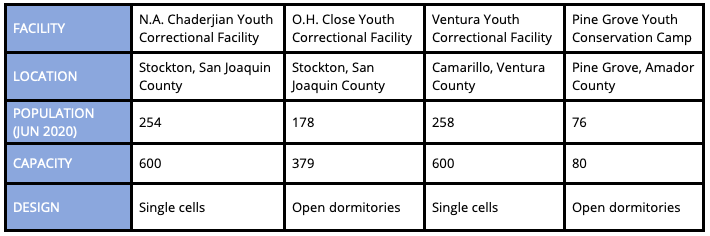
- N.A.Chaderjian Youth Correctional Facility
- O.H. Close Youth Correctional Facility
- Ventura Youth Correctional Facility
- Pine Grove Youth Conservation Camp
February 2020-February 2021
- N.A.Chaderjian Youth Correctional Facility
- O.H. Close Youth Correctional Facility
- Ventura Youth Correctional Facility
- Pine Grove Youth Conservation Camp
March 2020-March 2021
- N.A.Chaderjian Youth Correctional Facility
- O.H. Close Youth Correctional Facility
- Ventura Youth Correctional Facility
- Pine Grove Youth Conservation Camp
April 2020-April 2021
- N.A.Chaderjian Youth Correctional Facility
- O.H. Close Youth Correctional Facility
- Ventura Youth Correctional Facility
- Pine Grove Youth Conservation Camp
June 2020-June 2021
- N.A.Chaderjian Youth Correctional Facility
- O.H. Close Youth Correctional Facility
- Ventura Youth Correctional Facility
- Pine Grove Youth Conservation Camp
November 2020-November 2021
- N.A.Chaderjian Youth Correctional Facility
- O.H. Close Youth Correctional Facility
- Ventura Youth Correctional Facility
- Pine Grove Youth Conservation Camp
Senate Bill 518 Reports provide annual summaries of the number of grievances filed with the Office of the Ombudsman that pertain to DJJ. These reports list the nature of each grievance, the actions taken to address the grievance, the number of referrals made, and the number of unresolved grievances. They are available for 2010 through 2020.
County Commitment Rate Reports provide data on the number of youth committed to DJJ each year broken out by county of origin and type of committing court (juvenile vs. adult). These reports are available for 2010 through 2020.
Fiscal Year Population Reports present DJJ’s population data on a fiscal year basis broken out by facility. These reports are available for FY 2010-11 through FY 2020 – 21.
- FY 2011-12
- FY 2012 – 13
- FY 2013 – 14
- FY 2014 – 15
- FY 2015 – 16
- FY 2016 – 17
- FY 2017 – 18
- FY 2018 – 19
- FY 2019 – 20
- FY 2020 – 21
Population Characteristics Reports break out DJJ’s population by age, gender, race and ethnicity, committing offense, committing county, committing court type (juvenile vs. adult), and board category. These reports are produced semi-annually. They are available for June 2010 through June 2021.
- June 2010
- December 2010
- June 2011
- December 2011
- June 2012
- December 2012
- June 2013
- December 2013
- June 2014
- December 2014
- June 2015
- December 2015
- June 2016
- December 2016
- June 2017
- December 2017
- June 2018
- December 2018
- June 2019
- December 2019
- June 2020
- December 2020
- June 2021
- December 2021
Population Overview Reports provide annual population data by race, ethnicity, gender, age, and offense. They also list counties with the largest number of DJJ commitments and include data on youths’ average length of stay broken out by gender, committing court type (juvenile vs. adult), and offense. These reports are available for 2010 through 2020.
Living Unit Population Reports provide monthly data on the number and ages of youth held in each of DJJ’s living units, including the Mental health Residential Unit, Sexual Behavior Treatment Program, and Behavior Treatment Program. These reports are available for January 2011 through July 2021.
- January 2011
- February 2011
- March 2011
- April 2011
- May 2011
- June 2011
- July 2011
- August 2011
- September 2011
- October 2011
- November 2011
- December 2011
- January 2015
- February 2015
- March 2015
- April 2015
- May 2015
- June 2015
- July 2015
- August 2015
- September 2015
- October 2015
- November 2015
- December 2015
- January 2019
- February 2019
- March 2019
- April 2019
- May 2019
- June 2019
- July 2019
- August 2019
- September 2019
- October 2019
- November 2019
- December 2019
- January 2012
- February 2012
- March 2012
- April 2012
- May 2012
- June 2012
- July 2012
- August 2012
- September 2012
- October 2012
- November 2012
- December 2012
- January 2016
- February 2016
- March 2016
- April 2016
- May 2016
- June 2016
- July 2016
- August 2016
- September 2016
- October 2016
- November 2016
- December 2016
- January 2020
- February 2020
- March 2020
- April 2020
- May 2020
- June 2020
- July 2020
- August 2020
- Septemer 2020
- October 2020
- November 2020
- December 2020
- January 2013
- February 2013
- March 2013
- April 2013
- May 2013
- June 2013
- July 2013
- August 2013
- September 2013
- October 2013
- November 2013
- December 2013
- January 2017
- February 2017
- March 2017
- April 2017
- May 2017
- June 2017
- July 2017
- August 2017
- September 2017
- October 2017
- November 2017
- December 2017
- January 2021
- Februrary 2021
- March 2021
- April 2021
- May 2021
- June 2021
- July 2021
- August 2021
- September 2021
- October 2021
- November 2021
- December 2021
- January 2014
- February 2014
- March 2014
- April 2014
- May 2014
- June 2014
- July 2014
- August 2014
- September 2014
- October 2014
- November 2014
- December 2014
- January 2018
- February 2018
- March 2018
- April 2018
- May 2018
- June 2018
- July 2018
- August 2018
- September 2018
- October 2018
- November 2018
- December 2018
- January 2022
Transition Materials